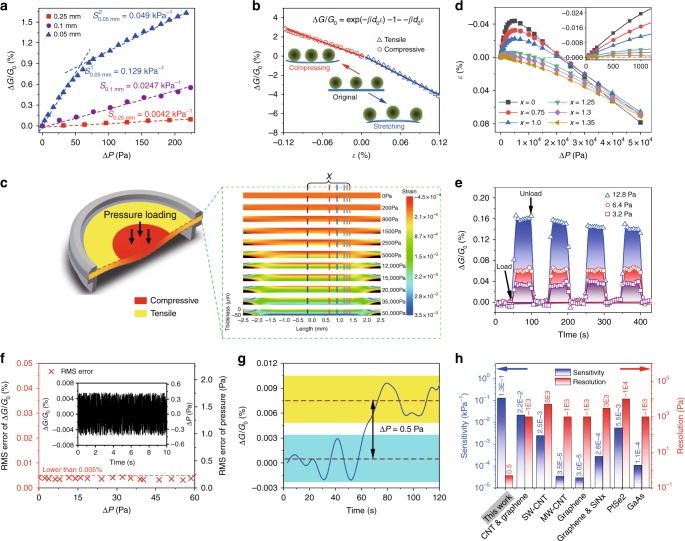
Fig. 2.
Detection of tiny differential pressures. a Pressure-response curves for PET membranes of different thicknesses. Error bars represent the s.d. of the conductance. b ΔG/G0 versus strain ε curves for an actuation layer in the pressure sensor. c The FEA result of the strain distribution on the cross-section along the center line of the PET membrane under different pressures. d Mechanical deformation at various position on the upper surface of the PET membrane. x denotes distance between the center of PET and the point as shown in c. The inset is a partial amplification of the low pressure regime. e ΔG/G0 response of loading and unloading cycles for different pressures. f The RMS error in ΔG/G0 at different ΔP. The inset shows a typical ΔG/G0 fluctuation, which was used to calculate the RMS errors. Both right axes show the pressure converted from left ΔG/G0. g Real-time transient ΔG/G0 by applying ΔP = 0.5 Pa. Data of e, f, and g were from measurements on a sensor with a 0.05-mm-thick PET. h A comparison of the sensitivity and resolution of the present device with other nanostructure-based pressure sensors. Source data are provided as a Source Data file

