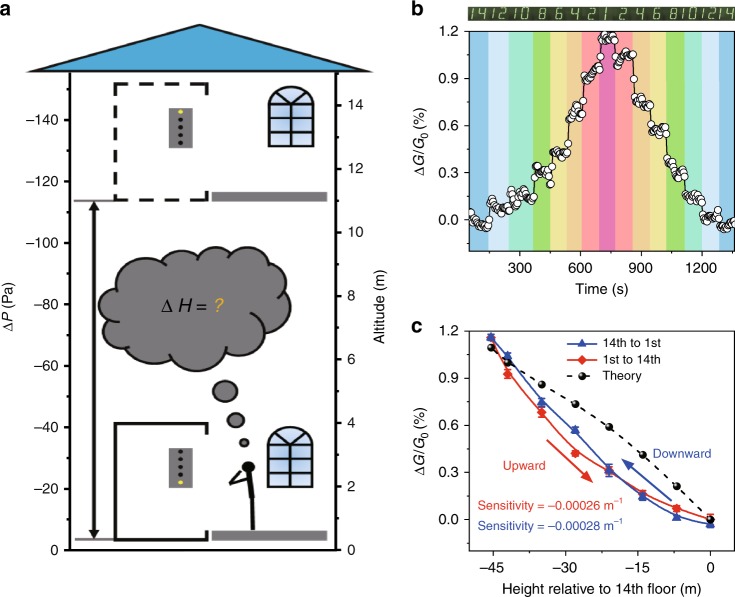
Fig. 4.
Altitude measurement with the pressure sensor. a A schematic diagram of differential pressure ΔP to 1 atmosphere as a function of altitude. b Real-time conductance changes in response to the variation in the floor elevation. The recorded signal corresponding to each floor is indicated by different colored bars. c Measured and calculated ΔG/G0 versus height curve. Note that G0 used here is the conductance of the NP arrays measured at 14th floor. It corresponds to the conductance of the NP particle array under 500 Pa pressure. Error bars represent the s.d. of conductance. Source data are provided as a Source Data file

