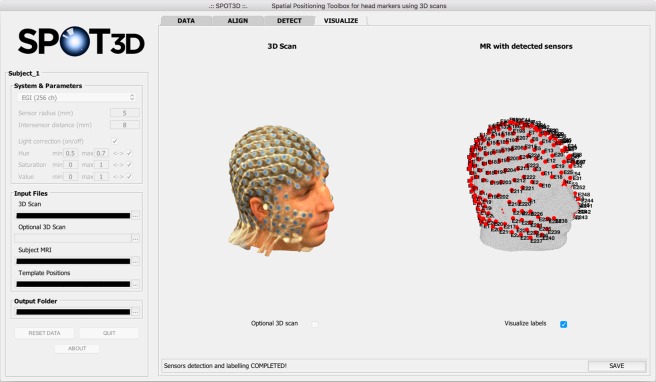
Figure 5.
Screen capture of the SPOT3D interface, showing the VISUALIZE tab. This tab shows the individual 3D scan on the left and the head shape extracted from the structural MR image on the right, with the detected sensor positions visualized as red dots and, optionally, the facial landmarks visualized as red stars. The user can also choose to visualize the optional 3D scan and the label of each sensor/landmark. In the bottom right corner of the tab, the SAVE button allows the user to save the final sensor positioning results in .sfp and .mat formats.

