
Figure 2.
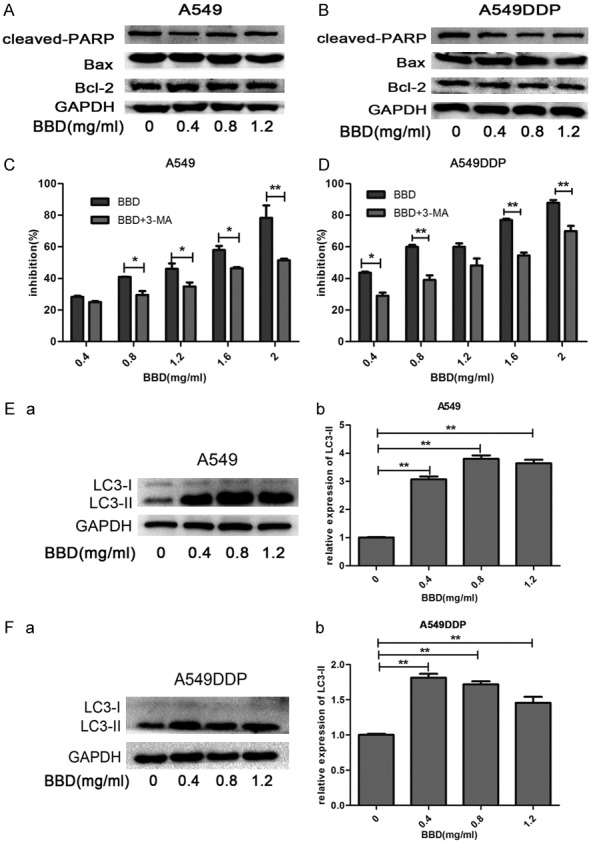
BBD induced cytotoxicity in A549 and A549DDP primarily by autophagy. A549 (A) and A549DDP (B) cells were treated with different concentrations of BBD, the cellular proteins Bcl-2, Bax, caspase-cleaved PARP were determined by Western-blot analysis. A549 (C) and A549DDP (D) cells were pretreated with 3-MA, and then treated for another 24 hours with BBD, cell viability was then determined by CCK8 assay and compared to the BBD treatment alone. (E, F) Western blot analysis of LC3II expression after BBD administration for 24 hours in both cells. The corresponding expression levels are shown as bar graphs. *, P < 0.05; **, P < 0.01.