Abstract
Non-small cell lung cancer (NSCLC) is accounted for 80% to 85% of the total lung cancer cases and still a difficult problem to solve at present. The present study was aimed to explore the effect of S100A6 on the proliferation, invasion, migration and angiogenesis in lung cancer cell lines with the change of miR-193a expression and P53 acetylation. The expression of S100A6, CDK2, cyclinD1, VEGF, ANGII, anti-acetylp53 (K373), K-AC, P21 and Noxa were analyzed by western blot analysis. RT-qPCR analysis was used to confirm the transfection effects. CCK-8 assay and flow cytometry were reflecting the cell proliferation. Wound healing assay and transwell assay were evaluating the cell invasion and migration. The dual-luciferase reporter assay was to confirm the S100A6 as a target of miR-193a. Immunofluorescence and immunohistochemical analysis were analyzing the S100A6 expression in cells and tumor tissues, respectively. As a result, S100A6 expression was increased in lung cancer cell lines and S100A6 expressed the highest in A549 cells which was chosen for the subsequent experiment. S100A6 overexpression promoted the proliferation, invasion, migration and angiogenesis of lung cancer cells with the promotion of degradation of P53 acetylation. In addition, S100A6 was demonstrated to be a target of miR193a. Moreover, miR193a expression was decreased in lung cancer cell lines and miR193a expressed the lowest in A549 cells which was chosen for the subsequent experiment. And, miR193a overexpression inhibited the proliferation, invasion, migration and angiogenesis of lung cancer cells with the enhancement of P53 acetylation. The effects of S100A6 overexpression and miR193a overexpression on tumor growth in vivo experiments were the same with that in the cell experiments. In conclusion, this study indicated that S100A6 overexpression could promote the proliferation, invasion, migration and angiogenesis of lung cancer cells by inhibiting the P53 acetylation and miR193a overexpression could reversed the above effects by decreasing the S100A6 expression in both vitro and vivo experiments.
Keywords: S100A6/miR193a, proliferation, invasion, migration, angiogenesis, P53, acetylation, lung cancer
Introduction
Lung cancer is one of the most dangerous malignancies with the fastest increase of morbidity and mortality [1]. Non-small cell lung cancer (NSCLC) is the most common type of lung cancer, accounting for 80% to 85% of the total lung cancer cases. Because the early-stage specific clinical manifestations are not obvious, clinical diagnosis of NSCLC patients has often progressed to the advanced stage of tumor. In addition, the treatment effect of most patients in this stage is limited, and the 5-year survival rate is about 14% [2,3]. Therefore, a therapeutic method for NSCLC is urgently needed.
The S100 family includes at least 20 members, of which the family has been reported to be abnormally expressed in different stages of cancer. S100A6 is a calcium (cellular) peripheral protein that regulates cytoskeletal protein dynamics, cell proliferation, differentiation, calcium metabolism, ubiquitination and acetylation [4-7]. S100A6 was increased in cervical cancer cells and S100A6 overexpression could increase the proliferation and migration of cervical cancer cells [8]. Also, S100A6 was up-regulated in gastric cancer cells and cell proliferation was promoted by S100A6 overexpression [9]. In pancreatic cancer, S100A6 increased the mobility of cancer cells by targeting annexin2 [10]. It has been reported that the expression of S100A6 in the cancer tissues and blood of lung cancer patients is increased and S100A6 can promote tumor angiogenesis, which predicts poor prognosis of patients with lung cancer [11,12]. S100A6 binds to P53 protein and regulates cell proliferation and apoptosis [13]. In addition, study has shown that S1000A6 inhibits the transcriptional activation of P53 by the degradation of acetylation of P53, so that cell apoptosis can be inhibited which go to cancerization [14]. However, the effect of S100A6 on proliferation, invasion, migration and angiogenesis in lung cancer cell lines has not been studied.
MicroRNAs (miRNAs) are highly conserved endogenous small non-coding RNAs with the length of about 23 nucleotides [15,16]. miRNAs have been reported to play crucial biological functions in the tumor initiation and progression [17]. Moreover, miRNAs have be gradually applied for the diagnosis and treatment of cancer [18-20]. Study indicated that miR-146a expression was increased in human cervical cancer and miR-146a overexpression could inhibit the apoptosis of cervical cancer [21]. Roy, S et al. [22] found that levels of miRNA-193a-5p were decreased in mouse and human HCC cells and tissues and miRNA-193a-5p could prevent hepatocarcinogenesis by reducing levels of NUSAP1. The expression of miRNA-193a is decreased in colon cancer and other cancer tissues [23]. And, miRNA-193a has been reported as a tumor suppressor gene in non-small cell lung cancer [24]. To date, whether miRNA-193a expression can regulate the proliferation, invasion, migration and angiogenesis in lung cancer cell lines remains unknown.
Here, the purpose of this study is to explore the effect of S100A6 on the proliferation, invasion, migration and angiogenesis in lung cancer cell lines, and to investigate whether miRNA-193a overexpression can down-regulate the S100A6 expression to promote the acetylation of P53 leading to the activation of the transcription of P53, which inhibiting the proliferation of cancer cells and promoting the apoptosis of cancer cells.
Materials and methods
Cell culture
The human bronchial epithelioid cell lines (HBE) and NSCLC cell lines (A549, H441 and H1975) purchased from American Type Culture Collection (Rockville, MD, USA). Dulbecco’s modifed Eagle’s medium (DMEM) (Gibco, Grand Island, NY, USA) with 10% fetal bovine serum (FBS) (Hyclone, Australia) and 1% antibiotic-antimycotic solution was used to culture the cell lines in a humidified incubator with 5% CO2 at 37°C.
Western blot analysis
Briefly, cells and tumor tissues were lysed with RIPA buffer (Biocolors Biotechnology Co., Shanghai, China) to obtain the total proteins for the concentration measurement by BCA Protein Assay Kit (Pierce; Thermo Fisher Scientific, Inc.). Equal quantity of protein was subjected to sodium dodecyl sulfate-polyacrylamide gel electrophoresis (SDS-PAGE) and then transferred to polyvinylidene fluoride (PVDF) membranes (Millipore, USA). 5% nonfat milk in TBST (Tris-buffered saline plus 0.1% Tween 20) was used to block the nonspecific binding sites on the membrane for 1 h. Then, the membrane was incubated overnight at 4°C with primary antibody against S100A6 (#13162, dilution: 1:1000, Cell Signaling Technology, Inc. Danvers, Massachusetts, USA), CDK2 (#2546, dilution: 1:1000, Cell Signaling Technology), cyclinD1 (#2978, dilution: 1:1000, Cell Signaling Technology), VEGF (#2463, dilution: 1:1000, Cell Signaling Technology), ANGII (#79299, dilution: 1:1000, Cell Signaling Technology), anti-acetylp53 (K373) (ab62376, dilution: 1:1000, Abcam, USA), K-AC (), P21 (#2947, dilution: 1:1000, Cell Signaling Technology), Noxa (#14766, dilution: 1:1000, Cell Signaling Technology) and GAPDH (#5174, dilution: 1:1000, Cell Signaling Technology). GAPDH was used as a reference gene. Subsequently, anti-rabbit horseradish peroxidase-linked IgG secondary antibody (Cell Signaling Technology, Inc.) was added. Finally, the protein bands were visualized with an enhanced chemiluminescence detection system (Super Signal West Dura Extended Duration Substrate; Thermo Fisher Scientific, Inc.).
RT-qPCR analysis
RNAs from cells and tumor tissues were obtained with Trizol reagent (Invitrogen, Carlsbad, Calif, USA) as the standard protocol. Subsequently, cDNA was synthesized by Reverse Transcription System Kit (Invitrogen, Carlsbad, CA, USA). RT-qPCR was performed by a TaqMan Universal PCR Master Mix kit (Invitrogen; Thermo Fisher Scientific, Inc.). U6 and GAPDH were used as endogenous controls for miRNA and mRNA, respectively. The primer sequences for qPCR were as follows: U6 forward, 5’-CTCGCTTCGGCAGCACA-3’, and reverse, 5’-AACGCTTCACGAATTTGCGT-3’; miR-193a forward, 5’-GTCGTATCCAGTGCAGGGTCCGAGGTGCACTGGATACGACTCATCTC-3’, and reverse, 5’-GTCGTATCCAGTGCAGGGTCCGAGGGGTCCGAGGTATTCGCACTGGATACGACAAAATATGGAAC-3’; GAPDH forward, 5’-GAAGGTGAAGGTCGGAGTC-3’, and reverse, 5’-GAAGATGGTGATGGGATTTC-3’; S100A6 forward, 5’-ATGGCATGCCCCTGGATCAGG-3’, and reverse, 5’-TCAGCCCTTGAGGGCTTCAT-3’. The relative expression levels were calculated using 2-ΔΔCq method.
CCK-8 assay
After transfection for 24 h, 48 h and 72 h, Cell counting kit-8 (CCK-8, MSK, Wuhan, China) assay was performed to analyze cell viability according to the manufacturer instructions. The A5492 cells were planted into a 96-well plate and cultured at 37°C and 5% CO2. CCK-8 reagent was added to the cells, which incubated for 4 hours. Absorbance was detected at 450 nm using a light absorption microplate reader (Multistan FC; Thermo Fisher, USA).
Flow cytometry analysis
After transfection for 72 h, the cell cycle was analyzed by the flow cytometry. After washed with PBS, cells were digested with pancreatic enzymes which terminated by adding the PBS (20% fetal calf serum). Cells were stained with 5 µL Annexin V-FITC and 5 µL propidium iodide (PI) at 4°C in the dark for 15 min. The experimental results were analyzed with a BD Canto II flow cytometer (BD Biosciences, San Jose, CA, USA).
Wound healing assay
After transfection for 24 h, A5492 cell suspension was prepared and the cell concentration was adjusted to 5×10⁵/mL. 150 μL cell suspension was inoculated into the DMEM with Culture-Inter. After cells growing against the wall, culture-Inter was removed and the scratch width was observed and measured under a Zeiss LSM510 META microscope. After incubation for 48 h, the scratch width was again observed and photographed under the Zeiss LSM510 META microscope.
Transwell assay
After transfection for 24 h, A5492 cell suspension was prepared and the cell concentration was adjusted to 4×10⁵/mL. The prepared cell suspension was added to the upper chamber of Transwell at 200 μL, and the DMEM culture solution was added to the lower chamber at 500 μL. After 48 h of culture with air bubble elimination, the chamber fluid was removed and placed in PBS solution for cleaning. After the membrane was dried, the chamber was moved to 800 μL crystal violet and stained for 30 min. Then, it was gently rinsed with deionized water. Cotton swab was used to wipe off the liquid on the upper surface of the chamber. Transwell Chambers were inverted upside down and placed under a normal microscope Olympus BX53 for observation and photography.
Dual-luciferase reporter assay
Basing on the mircode software (http://www.mircode.org/), S100A6 was predicted as a potential target of miR-193a. The dual-luciferase reporter assay was for the confirmation of the S100A6 as a target of miR-193a. Briefly, the S100A6 3’UTR with the predicted miR-193a binding site or mutant was cloned into a pGL3 luciferase reporter vector. A549 cells were then co-transfected with either the vectors and the miR-193a mimics or NC control using Lipofectamine 2000. After A549 cells were transfected for 48 h, the luciferase assays were conducted with a Bright-Glo Luciferase Assay System (Promega, Madison, WI). The luciferase activity was normalized to the values of the Renilla luciferase activity.
Immunofluorescence staining
After transfection for 48 h, A549 cells were fixed with 4% paraformaldehyde at room temperature for 10 min. The paraformaldehyde was discarded and A549 cells were transparented with PBS containing 0.1% Triton x-100 for 30 min. A549 cells were incubated with 5% bovine serum for 30 min and then incubated with primary antibody against S100A6 (Abcam, USA) overnight at 4°C. After washing with PBS for 3 times, anti-mouse fluorescence secondary antibody (dilution, 1:100) was incubated at room temperature for 1 h in dark, followed by the 3 times PBS washing. A549 cells were stained with Hoechst for 10 min without light, washed with PBS for 3 times, and then sealed with anti-quenching agent. Fluorescence of cells was observed under fluorescence microscope (Nikon, Japan).
Xenograft model
Thirty five five-week-old male BALB/c nude mice (Guangdong medical laboratory animal center, Guangdong, China) were raised in a pathogen-free environment (12 h light/12 h dark cycle), with free access to food and water. There were two xenograft models: one was that tumors were implanted through the subcutaneous (s.c.) injection of A549 cells, A549 cells transfected with pcDNA and A549 cells transfected with pcDNA-S100A6, respectively into the right flank of the mice. Another one was that tumors were implanted through the subcutaneous (s.c.) injection of A549 cells, A549 cells transfected with miR-NC, A549 cells transfected with miR-193a mimic, and A549 cells co-transfected with miR-193a mimic and pcDNA-S100A6 respectively into the right flank of the mice. 1×10⁶ cells suspended in 0.1 mL PBS/Matrigel solution was injected to each mouse. The tumor volume and mice weight were observed and recorded at 1, 4, 7, 14 and 28 days.
Immunohistochemistry
Tumor tissues were paraffin-embedded and cut into 5 μm sections. The paraffin sections were dewaxed and hydrated. And then, sections were sealed with 5% normal rabbit serum for 20 min and incubated with primary antibody against S100A6 (Abcam, USA) at room temperature overnight. After PBST cleaning, sections were incubated with a biotinylated secondary IgG antibody (Santa Cruz Biotechnology, Santa Cruz, CA). Following PBST cleaning, sections were colored with DAB substrate solution for 20 min, counterstained with hematoxylin for 1 min, dehydrated routinely, transparented with xylene, sealed with neutral resin, and observed using an LSM 5 PASCAL confocal microscope (Carl Zeiss AG, Oberkochen, Germany).
Statistical analysis
The data are presented as the mean ± standard deviation (SD) and statistically analyzed by SPSS 22.0. Comparing the mean values between the two groups, a Student’s t-test was chosen. The means of multiple groups were compared using the one-way analysis of variance with Duncan’s multiple-range test. P<0.05 was identified to be statistically significant.
Results
S100A6 expression was increased in lung cancer cells
The western blot analysis was for the determination of S100A6 expression in lung cancer cells. Compared with the HBE cells group, the expression of S100A6 in lung cancer cell lines (A549, H441 and H1975) were all increased and the highest expression of S100A6 was found in A549 cells which was chosen for the subsequent experiment (Figure 1).
Figure 1.

S100A6 expression was increased in lung cancer cells. The expression of S100A6 in HBE cells, A549 cells, H441 cells and H1975 cells was detected by Western blot. ***P<0.001 vs. HBE cells.
S100A6 overexpression promoted the proliferation, invasion, migration and angiogenesis of lung cancer cells
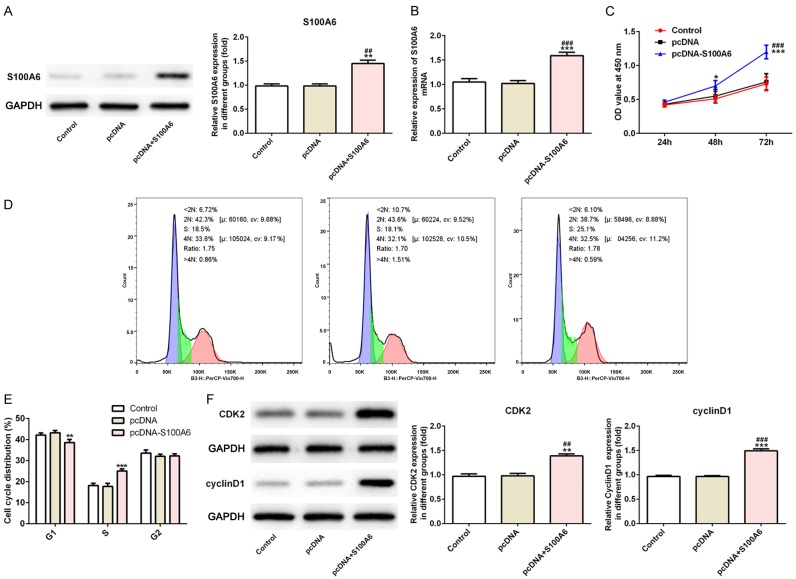
The transfection effect of S100A6 was verified by the RT-qPCR analysis and western blot analysis. Compared with the control group and pcDNA group, S100A6 expression was increased in pcDNA-S100A6 group, which indicated that the effect of overexpression was obvious (Figure 2A and 2B). With the prolongation of time (at 24, 48 and 72 h), the proliferation of A549 cells was increased obviously in pcDNA-S100A6 group compared with the control group and pcDNA group (Figure 2C). After transfection for 72 h, the results of flow cytometry analysis indicated that the S phase of the cell cycle was expanded and G1 and G2 phase was narrowed in pcDNA-S100A6 group (Figure 2D and 2E). After transfection for 72 h, cyclin CDK2 and cyclinD1 expression was increased in pcDNA-S100A6 group compared with the control group and pcDNA group (Figure 2F). As shown in Figure 3A, the invasion and migration of A549 cells transfected with pcDNA-S100A6 was obvious compared with the control group and pcDNA group. The western blot analysis was used to detect the expression of vascular regeneration protein (VEGF and ANGII) and the results indicated that the expression of VEGF and ANGII was increased in A549 cells transfected with pcDNA-S100A6 compared with the control group and pcDNA group (Figure 3B). The above experimental results indicated that S100A6 overexpression promoted the proliferation, invasion, migration and angiogenesis of lung cancer cells.
Figure 2.
S100A6 overexpression promoted the proliferation of lung cancer cells. A. The expression of S100A6 was increased in A549 cells after transfected with pcDNA-S100A6. **P<0.01 vs. control group. ##P<0.01 vs. pcDNA group. B. The mRNA expression of S100A6 was increased in A549 cells after transfected with pcDNA-S100A6. ***P<0.001 vs. control group. ###P<0.001 vs. pcDNA group. C. The cell viability of A549 cells was increased after transfected with pcDNA-S100A6. ***P<0.001 vs. control group. ###P<0.001 vs. pcDNA group. D. The cell cycle was detected by flow cytometry in control group, pcDNA group and pcDNA-S100A6 group. E. The S phase was expanded in A549 cells after transfected with pcDNA-S100A6. **P<0.01 vs. control group. ***P<0.001 vs. control group. F. The expression of CDK2 and cyclinD1 was increased in A549 cells after transfected with pcDNA-S100A6. **P<0.01 and ***P<0.001 vs. control group. ##P<0.01 and ###P<0.001 vs. pcDNA group.
Figure 3.
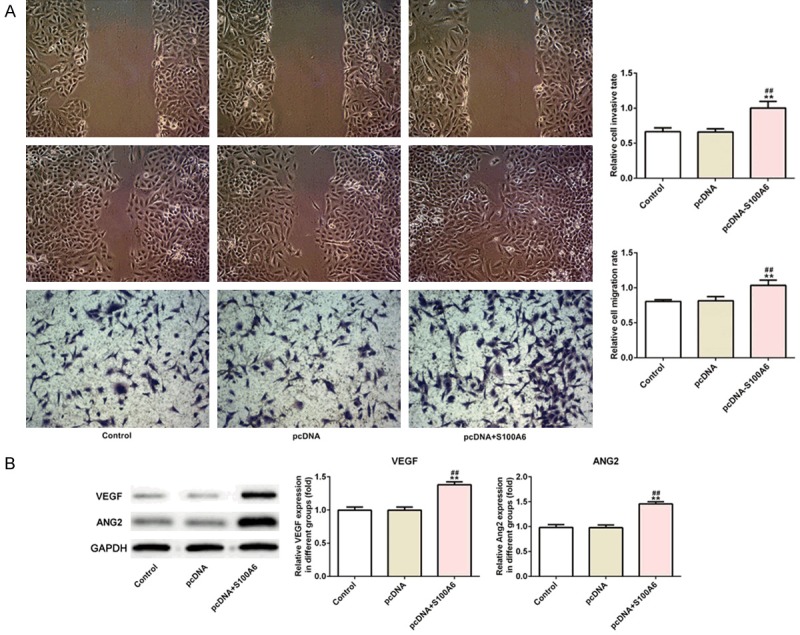
S100A6 overexpression promoted the invasion, migration and angiogenesis of lung cancer cells. A. The cell invasion and migration was increased in A549 cells after transfected with pcDNA-S100A6. **P<0.01 vs. control group. ##P<0.01 vs. pcDNA group. B. The expression of VEGF and ANG2 was increased in A549 cells after transfected with pcDNA-S100A6. **P<0.01 vs. control group. ##P<0.01 vs. pcDNA group.
S100A6 overexpression inhibited the P53 acetylation in lung cancer cells
The expression of anti-acetylp53 (K373), K-AC, P21 and Noxa was used to reflect the condition of P53 acetylation. The results of western blot analysis showed that K373 and K-AC expression was decreased in S100A6 overexpressed A549 cells compared with the control group and pcDNA group (Figure 4A). The expression of P53 downstream transcription factors was also detected by western blot analysis. The expression of P21 was decreased and Noxa was increased in S100A6 overexpressed A549 cells compared with the control group and pcDNA group (Figure 4B).
Figure 4.
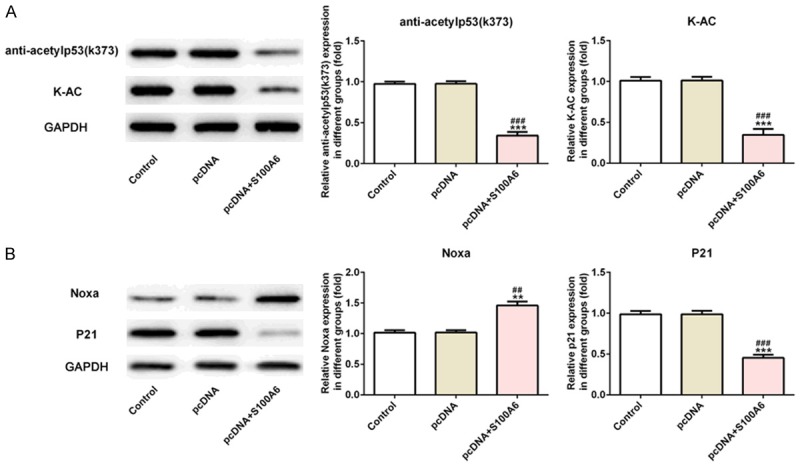
S100A6 overexpression inhibited the P53 acetylation in lung cancer cells. A. The expression of anti-acetylp53 (K373) and K-AC was decreased in A549 cells after transfected with pcDNA-S100A6. ***P<0.001 vs. control group. ###P<0.001 vs. pcDNA group. B. The expression of P21 was increased and Noxa was decreased in A549 cells after transfected with pcDNA-S100A6. **P<0.01 and ***P<0.001 vs. control group. ##P<0.01 and ###P<0.001 vs. pcDNA group.
MiR-193a directly targets S100A6
Bioinformatics analysis predicated that S100A6 was a potential target of miR-193a (Figure 5A) and the results also verified the prediction (Figure 5B). The miR-193a expression was decreased in S100A6 overexpressed A549 cells compared with the control group and pcDNA group (Figure 5C). The expression of miR-193a in HBE cells, A549 cells, H441 cells and H1975 cells was detected and miR-193a expression in A549 cells was the lowest which were selected for the subsequent experiment (Figure 5D).
Figure 5.
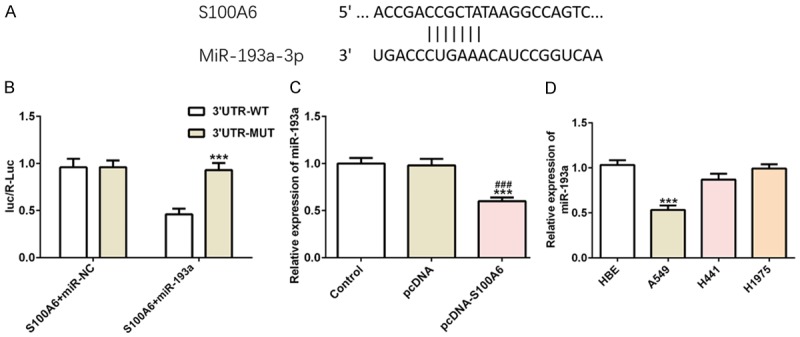
MiR-193a directly targets S100A6. A. The putative target sequence for miR-193a on the 3’UTR of S100A6. B. Luciferase reporter analysis revealed the target role of miR-193a on the 3’UTR of S100A6. C. The expression of miR-193a was decreased in A549 cells after transfected with pcDNA-S100A6. ***P<0.001 vs. control group. ###P<0.001 vs. pcDNA group. D. The expression of miR-193a was the lowest in HBE cells, A549 cells, H441 cells and H1975 cells. ***P<0.001 vs. HBE cells.
MiR-193a overexpression inhibited the proliferation, invasion, migration and angiogenesis of lung cancer cells
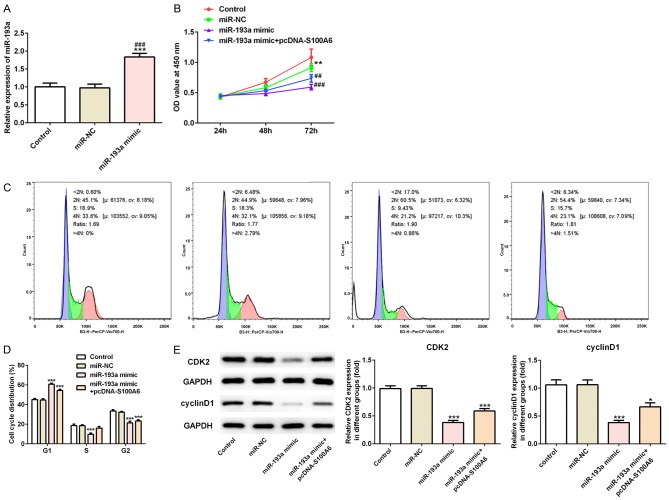
The miR-193a transfected effects were analyzed by RT-qPCR analysis, which showed that miR-193a was overexpressed in A549 cells transfected with miR-193a mimic compared with the control group and miR-NC group (Figure 6A). At the cell transfection at 24, 48 and 72 h, CCK-8 assay was detecting the ell viability. Compared with the control group and H2O2 group, the cell proliferation was gradually decreased with the extension of time in miR-193a overexpression A549 cells. However, the cell proliferation was going up when A549 cells transfected with miR-193a mimic and pcDNA-S100A6 (Figure 6B). After transfection for 72 h, the S phase of the cell cycle was narrowed and G1 and G2 phase was expanded in miR-193a overexpressed A549 cells. However, the S phase of the cell cycle was expanded and G1 and G2 phase was narrowed in A549 cells transfected with miR-193a mimic and pcDNA-S100A6 (Figure 6C and 6D). The expression of cyclin CDK2 and cyclinD1 was decreased in miR-193a overexpressed A549 cells compared with the control group and miR-NC group. Compared with the miR-193a mimic group, the expression of cyclin CDK2 and cyclinD1 was increased in A549 cells transfected with miR-193a mimic and pcDNA-S100A6 (Figure 6E). Compared with the control group and miR-NC group, the invasion and migration of A549 cells was decreased in miR-193a mimic group while the invasion and migration of A549 cells was somewhat reversed in miR-193a mimic+pcDNA-S100A6 group (Figure 7A). The expression of VEGF and ANGII was decreased in miR-193a mimic group compared with the control group and miR-NC group while the expression of VEGF and ANGII was recovered in miR-193a mimic+pcDNA-S100A6 group (Figure 7B).
Figure 6.
MiR-193a overexpression inhibited the proliferation of lung cancer cells. A. The expression of miR-193a was increased in A549 cells after transfected with miR-193a mimic. ***P<0.001 vs. control group. ###P<0.001 vs. miR-NC group. B. The cell viability was decreased in miR-193a mimic group and reversed in miR-193a mimic+pcDNA-S100A6 group. **P<0.01 vs. control group. ##P<0.01 and ###P<0.001 vs. miR-NC group. C. The cell cycle was detected by flow cytometry in control group, miR-NC group, miR-193a mimic group and miR-193a mimic+pcDNA-S100A6 group. D. The S phase of the cell cycle was narrowed in A549 cells after transfected with miR-193a mimic. ***P<0.001 vs. control group. E. The expression of CDK2 and cyclinD1 was decreased in A549 cells after transfected with miR-193a mimic and reversed in A549 cells after transfected with miR-193a mimic+pcDNA-S100A6. *P<0.05 and ***P<0.001 vs. control group.
Figure 7.
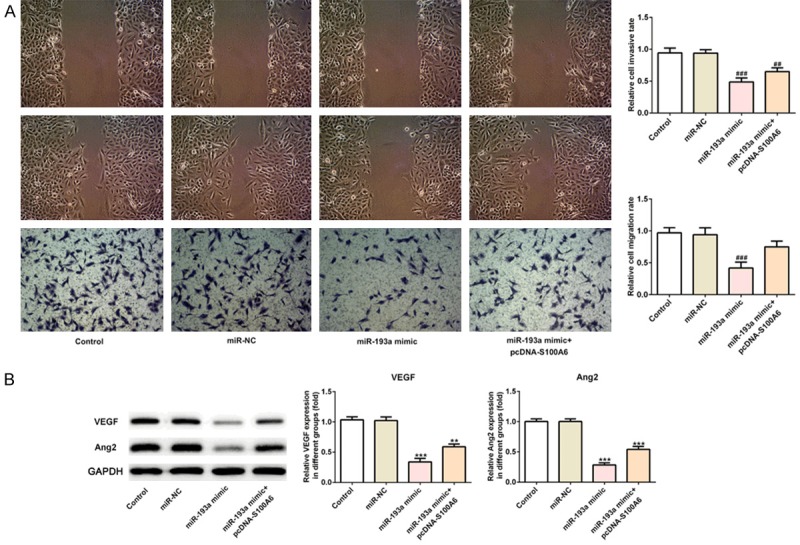
MiR-193a overexpression inhibited the invasion, migration and angiogenesis of lung cancer cells. A. The cell invasion and migration was decreased in A549 cells after transfected with miR-193a mimic and reversed in A549 cells after transfected with miR-193a mimic+pcDNA-S100A6. ##P<0.01 and ###P<0.001 vs. miR-NC group. B. The expression of VEGF and ANG2 was increased in A549 cells after transfected with miR-193a mimic and reversed in A549 cells after transfected with miR-193a mimic+pcDNA-S100A6. **P<0.01 and ***P<0.001 vs. control group.
MiR-193a overexpression reduced the expression of S100A6
As shown in Figure 8A, the results of western blot analysis showed that S100A6 expression was down-regulated in miR-193a mimic group compared with the control group and miR-NC group. The S100A6 expression showed a pickup in miR-193a mimic+pcDNA-S100A6 group compared with the miR-193a mimic group. And, the results of Immunofluorescence staining for the detecting the S100A6 expression were same with the western blot analysis (Figure 8B).
Figure 8.
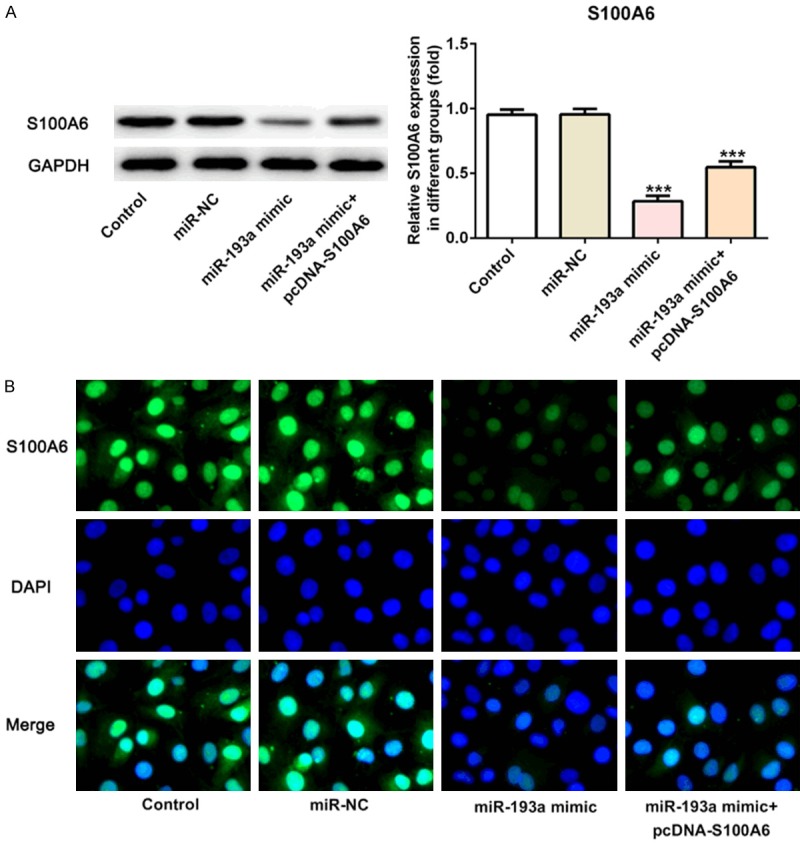
MiR-193a overexpression reduced the expression of S100A6. A. The expression of S100A6 was decreased in A549 cells after transfected with miR-193a mimic and reversed in A549 cells after transfected with miR-193a mimic+pcDNA-S100A6. ***P<0.001 vs. control group. B. The expression of S100A6 in control group, miR-NC group, miR-193a mimic group and miR-193a mimic+pcDNA-S100A6 group was analyzed by Immunofluorescence staining.
MiR-193a overexpression increased the P53 acetylation
Compared with the control group and miR-NC group, the expression of anti-acetylp53 (K373) and K-AC was increased in miR-193a mimic group while the expression of anti-acetylp53 (K373) and K-AC was decreased in miR-193a mimic+pcDNA-S100A6 group compared with the miR-193a mimic group (Figure 9A). And, the expression of P53 downstream transcription factors (P21 and Noxa) showed that P21 expression was increased and Noxa expression was decreased in miR-193a mimic group compared with the control group and miR-NC group while P21 expression was decreased and Noxa expression was increased in miR-193a mimic+pcDNA-S100A6 group compared with the miR-193a mimic group (Figure 9B).
Figure 9.
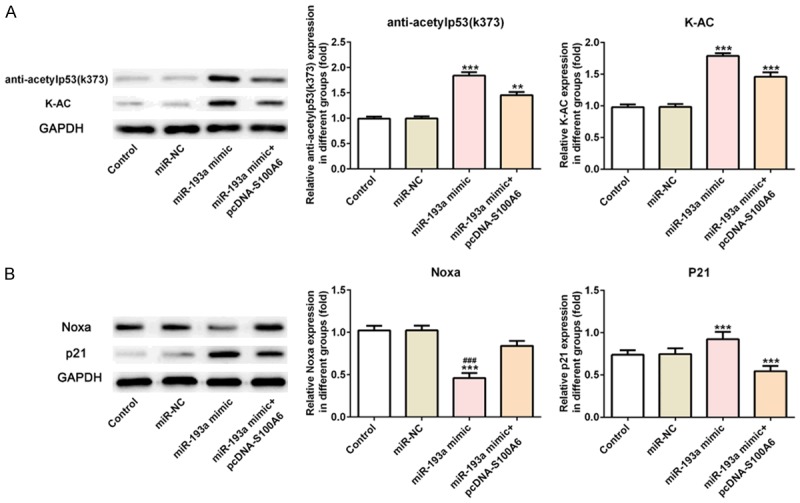
MiR-193a overexpression increased the P53 acetylation. A. The expression of anti-acetylp53 (K373) and K-AC was increased in A549 cells after transfected with miR-193a mimic and reversed in A549 cells after transfected with miR-193a mimic+pcDNA-S100A6. **P<0.01 and ***P<0.001 vs. control group. B. The expression of P21 was increased and Noxa was decreased in A549 cells after transfected with miR-193a mimic and reversed in A549 cells after transfected with miR-193a mimic+pcDNA-S100A6. ***P<0.001 vs. control group. ###P<0.001 vs. miR-NC group.
Effect of S100A6 overexpression in vivo study
Compared with the control group and pcDNA group, the tumor volume was increased with the time and weight of mice was increased with the time which showed that S100A6 overexpression promoted tumor growth (Figure 10A). Compared with the control group and pcDNA group, the expression of anti-acetylp53 (K373) and K-AC in tumor tissues was decreased in pcDNA-S100A6 group (Figure 10B). Compared with the control group and pcDNA group, P21 expression was decreased and Noxa expression in tumor tissues was increased in pcDNA-S100A6 group (Figure 10C). Those results showed that S100A6 overexpression inhibited P53 acetylation. Compared with the control group and pcDNA group, S100A6 overexpression decreased the miR-193a expression in tumor tissues (Figure 10D).
Figure 10.
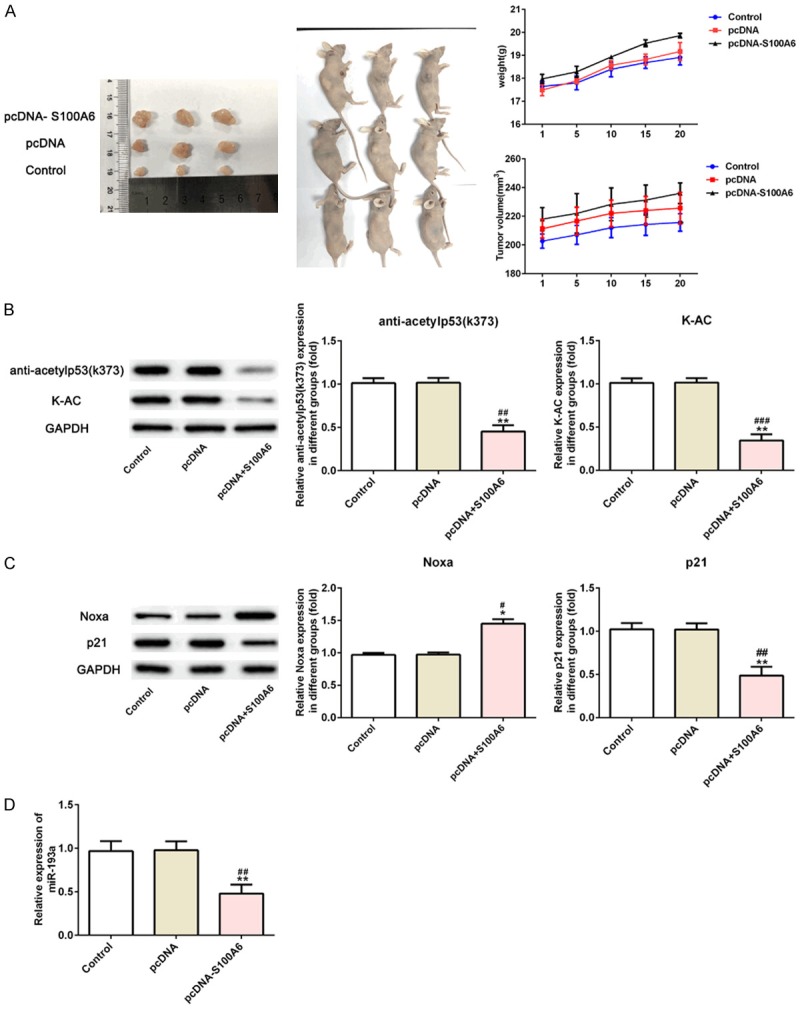
Effect of S100A6 overexpression in vivo study. A. The tumor weight and mice body weight were increased after mice transfected with pcDNA-S100A6. B. The expression of anti-acetylp53 (K373) and K-AC was decreased after mice transfected with pcDNA-S100A6. **P<0.01 vs. control group. ##P<0.01 and ###P<0.001 vs. pcDNA group. C. The expression of P21 was decreased and Noxa was increased after mice transfected with pcDNA-S100A6. *P<0.05 and **P<0.01 vs. control group. #P<0.01 and ##P<0.01 vs. pcDNA group. D. The expression of miR-193a was decreased after mice transfected with pcDNA-S100A6. **P<0.01 vs. control group. ##P<0.01 vs. pcDNA group.
Effect of miR-193a overexpression in vivo study
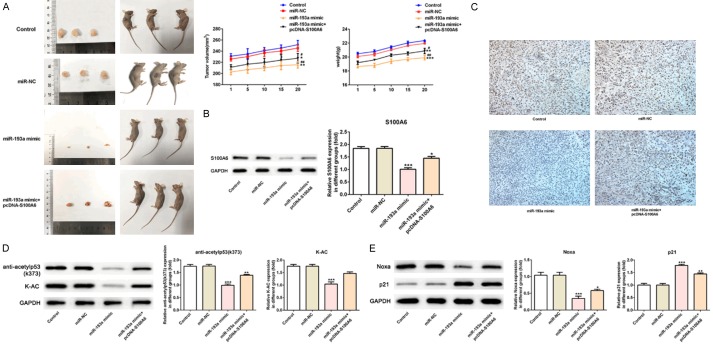
Compared with the control group and miR-NC group, the tumor volume was decreased with the time and weight of mice was decreased with the time while that was somewhat reversed in miR-193a mimic+pcDNA-S100A6 group which showed that miR-193a overexpression could inhibit the growth of tumor and S100A6 could promote the growth of tumor (Figure 11A). Compared with the control group and miR-NC group, S100A6 expression was decreased in miR-193a mimic group and S100A6 expression rose up in miR-193a mimic+pcDNA-S100A6 group (Figure 11B) which were same with the results showed by immunohistochemistry in tumor tissues (Figure 11C). Compared with the control group and miR-NC group, the expression of anti-acetylp53 (K373) and K-AC in tumor tissues was increased in miR-193a mimic group while the expression of anti-acetylp53 (K373) and K-AC in tumor tissues was decreased in miR-193a mimic+pcDNA-S100A6 group compared with miR-193a mimic group (Figure 11D). Compared with the control group and miR-NC group, P21 expression was increased and Noxa expression was decreased in tumor tissues in miR-193a mimic group while the expression of P21 and Noxa was reversed in tumor tissues in miR-193a mimic+pcDNA-S100A6 group which indicated that miR-193a overexpression could promote P53 acetylation and S100A6 could inhibit P53 acetylation (Figure 11E).
Figure 11.
Effect of miR-193a overexpression in vivo study. A. The tumor weight and mice body weight were decreased after mice transfected with miR-193a mimic and reversed in A549 cells after transfected with miR-193a mimic+pcDNA-S100A6. *P<0.05, **P<0.01 and ***P<0.01 vs. control group. #P<0.01 and ##P<0.01 vs. miR-NC group. B. The expression of S100A6 was decreased after mice transfected with miR-193a mimic and reversed in A549 cells after transfected with miR-193a mimic+pcDNA-S100A6. *P<0.05 and ***P<0.01 vs. control group. C. The expression of S100A6 in control group, miR-NC group, miR-193a mimic group and miR-193a mimic+pcDNA-S100A6 group was detected by immunohistochemistry. D. The expression of anti-acetylp53 (K373) and K-AC was decreased after mice transfected with miR-193a mimic and reversed in A549 cells after transfected with miR-193a mimic+pcDNA-S100A6. **P<0.01 and ***P<0.01 vs. control group. E. The expression of P21 was increased and Noxa was decreased after mice transfected with miR-193a mimic and reversed in A549 cells after transfected with miR-193a mimic+pcDNA-S100A6. *P<0.05, **P<0.01and ***P<0.01 vs. control group.
Discussion
Here, we investigated the role of S100A6/miR193a in the regulation of the proliferation, invasion, migration and angiogenesis of lung cancer cells through the acetylation of P53. The experimental results indicated that S100A6 overexpression promoted the proliferation, invasion, migration and angiogenesis of lung cancer cells and miR-193a overexpression inhibited the proliferation, invasion, migration and angiogenesis of lung cancer cells by inhibiting S100A6 expression through the regulation of P53 acetylation.
Calcium cyclin S100A6 is a member of the S100 family and is involved in regulating cell proliferation, apoptosis, cytoskeletal remodeling and stress response [25]. The current results showed that S100A6 expression was affected by many factors and NF-kB could activate the promoter of S100A6, while P53 could inhibit the transcription of S100A6 at the transcription level [26,27]. S100A6 was highly expressed in colorectal cancer tissues and cell lines, and promoted the proliferation, migration and invasion of colorectal cancer cells, which was closely related to the poor prognosis of patients [28]. Also, S100A6 was found to be increased in lung cancer tissues and serum [11,12]. Therefore, we speculated whether S100A6 promoted proliferation, invasion, migration and angiogenesis of lung cancer cell lines. Here, the results of our study verified our hypothesis which stated that S100A6 promoted proliferation, invasion, migration and angiogenesis of lung cancer cell lines. And, S100A6 overexpression promoted the degradation of P53 acetylation which was consistent with that S1000A6 inhibited the transcriptional activation of P53 leading to the production of cancerous cells [14].
Many existing studies have demonstrated that miR-193a participates in the development of multiple cancers and miR-193a can regulate multiple cancers. For example, miR-193a-5p was obviously decreased in gastric cancer (GC), but only miR-193a-3p obviously inhibited gastric growth and motility [22]. Huang et al. found that GC cells proliferation was inhibited by miR-193a-3p overexpression while down-regulated miR-193a-3p could reverse the changes [24]. miR-193a overexpression in colon cancer cells could inhibit cell proliferation, promote cell apoptosis and cause obvious changes in cell cycles [29]. miR-193a expression and breast cancer tissues had significant negative correlation and restoring miR-193a expression is good for the treatment of breast cancer [30]. miR-193a-3p is a tumor-related miRNA which is involved in tumorigenesis and progression of non-small cell lung cancer (NSCLC) and can be a predictor of deterioration of NSCLC patients [31]. Whether miR-193a overexpression could inhibit the proliferation, invasion, migration and angiogenesis of lung cancer cells remained unknown. This experimental data demonstrated that miR-193a expression was decreased, which was verified by the previous study [24]. And, miR-193a overexpression could suppress the proliferation, invasion, migration and angiogenesis of lung cancer cells by down-regulating the S100A6 expression, thereby increasing P53 acetylation. Bao et al. demonstrated that cell apoptosis and cycle arrest was increased in lung cancer cells by increasing P53 acetylation [32]. Delphinidin promoted cell apoptosis of prostate cancer cells through P53 up acetylation [33]. Therefore, P53 acetylation was related to the cell biological property and this experiment results were consistent with the published conclusions.
In conclusion, the present study demonstrated that S100A6 overexpression could promote the proliferation, invasion, migration and angiogenesis of lung cancer cells by inhibiting P53 acetylation and miR193a overexpression could reversed the above effects by decreasing the S100A6 expression to increase P53 acetylation.
Acknowledgements
2018 Henan Medical Science and Technology Public Relations Project, No. 2018020507.
Disclosure of conflict of interest
None.
References
- 1.Sun CC, Li SJ, Yuan ZP, Li DJ. MicroRNA-346 facilitates cell growth and metastasis, and suppresses cell apoptosis in human non-small cell lung cancer by regulation of XPC/ERK/Snail/E-cadherin pathway. Aging (Albany NY) 2016;8:2509–2524. doi: 10.18632/aging.101080. [DOI] [PMC free article] [PubMed] [Google Scholar] [Retracted]
- 2.Zakowski MF. Analytic inquiry: molecular testing in lung cancer. Cancer Cytopathol. 2017;125:470. doi: 10.1002/cncy.21866. [DOI] [PubMed] [Google Scholar]
- 3.Soria JC, Ohe Y, Vansteenkiste J, Reungwetwattana T, Chewaskulyong B, Lee KH, Dechaphunkul A, Imamura F, Nogami N, Kurata T, Okamoto I, Zhou C, Cho BC, Cheng Y, Cho EK, Voon PJ, Planchard D, Su WC, Gray JE, Lee SM, Hodge R, Marotti M, Rukazenkov Y, Ramalingam SS FLAURA Investigators. Osimertinib in untreated EGFR-mutated advanced non-small-cell lung cancer. N Engl J Med. 2018;378:113. doi: 10.1056/NEJMoa1713137. [DOI] [PubMed] [Google Scholar]
- 4.Cross SS, Hamdy FC, Deloulme JC, Rehman I. Expression of S100 proteins in normal human tissues and common cancers using tissue microarrays: S100A6, S100A8, S100A9 and S100A11 are all overexpressed in common cancers. Histopathology. 2005;46:256–69. doi: 10.1111/j.1365-2559.2005.02097.x. [DOI] [PubMed] [Google Scholar]
- 5.Emberley ED, Murphy LC, Watson PH. S100 proteins and their influence on pro-survival pathways in cancer. Biochem Cell Biol. 2004;82:508–15. doi: 10.1139/o04-052. [DOI] [PubMed] [Google Scholar]
- 6.Tsoporis JN, Izhar S, Parker TG. Expression of S100A6 in cardiac myocytes limits apoptosis induced by tumor necrosis factor-alpha. J Biol Chem. 2008;283:30174–83. doi: 10.1074/jbc.M805318200. [DOI] [PMC free article] [PubMed] [Google Scholar]
- 7.Ishii A, Suzuki M, Satomi K, Kobayashi H, Sakashita S, Kano J, Pei Y, Minami Y, Ishikawa S, Noguchi M. Increased cytoplasmic S100A6 expression is associated with pulmonary adenocarcinoma progression. Pathol Int. 2009;59:623–30. doi: 10.1111/j.1440-1827.2009.02417.x. [DOI] [PubMed] [Google Scholar]
- 8.Li A, Gu Y, Li X, Sun H, Zha H, Xie J, Zhao J, Huang M, Chen L, Peng Q, Zhang Y, Weng Y, Zhou L. S100A6 promotes the proliferation and migration of cervical cancer cells via the PI3K/Akt signaling pathway. Oncol Lett. 2018;15:5685–5693. doi: 10.3892/ol.2018.8018. [DOI] [PMC free article] [PubMed] [Google Scholar]
- 9.Wang XH, Du H, Li L, Shao DF, Zhong XY, Hu Y, Liu YQ, Xing XF, Cheng XJ, Guo T, Li S, Li ZY, Bu ZD, Wen XZ, Zhang LH, Ji JF. Increased expression of S100A6 promotes cell proliferation in gastric cancer cells. Oncol Lett. 2017;13:222–230. doi: 10.3892/ol.2016.5419. [DOI] [PMC free article] [PubMed] [Google Scholar]
- 10.Nedjadi T, Kitteringham N, Campbell F, Jenkins RE, Park BK, Navarro P, Ashcroft F, Tepikin A, Neoptolemos JP, Costello E. S100A6 binds to annexin 2 in pancreatic cancer cells and promotes pancreatic cancer cell motility. Br J Cancer. 2009;101:1145–1154. doi: 10.1038/sj.bjc.6605289. [DOI] [PMC free article] [PubMed] [Google Scholar]
- 11.Wang T, Liang Y, Thakur A, Zhang S, Yang T, Chen T, Gao L, Chen M, Ren H. Diagnostic significance of S100A2 and S100A6 levels in sera of patients with non-small cell lung cancer. Tumour Biol. 2016;37:2299–304. doi: 10.1007/s13277-015-4057-z. [DOI] [PubMed] [Google Scholar]
- 12.He X, Xu X, Khan AQ, Ling W. High expression of S100A6 predicts unfavorable prognosis of lung squamous cell cancer. Med Sci Monit. 2017;23:5011–5017. doi: 10.12659/MSM.904279. [DOI] [PMC free article] [PubMed] [Google Scholar]
- 13.Levine AJ. p53, the cellular gatekeeper for growth and division. Cell. 1997;88:323–331. doi: 10.1016/s0092-8674(00)81871-1. [DOI] [PubMed] [Google Scholar]
- 14.Graczyk A, Slomnicki LP, Lesniak W. S100A6 competes with the TAZ2 domain of p300 for binding to p53 and attenuates p53 acetylation. J Mol Bio. 2013;425:3488–3494. doi: 10.1016/j.jmb.2013.06.007. [DOI] [PubMed] [Google Scholar]
- 15.Wienholds E, Plasterk RH. MicroRNA function in animal development. FEBS Lett. 2005;579:5911–5922. doi: 10.1016/j.febslet.2005.07.070. [DOI] [PubMed] [Google Scholar]
- 16.Kim VN, Han J, Siomi MC. Biogenesis of small RNAs in animals. Nat Rev Mol Cell Biol. 2009;10:126–139. doi: 10.1038/nrm2632. [DOI] [PubMed] [Google Scholar]
- 17.Romero-Cordoba SL, Salido-Guadarrama I, Rodriguez-Dorantes M, Hidalgo-Miranda A. miRNA biogenesis: biological impact in the development of cancer. Cancer Biol Ther. 2014;15:1444–1455. doi: 10.4161/15384047.2014.955442. [DOI] [PMC free article] [PubMed] [Google Scholar]
- 18.Naidu S, Magee P, Garofalo M. miRNA-based therapeutic intervention of cancer. J Hematol Oncol. 2015;8:68. doi: 10.1186/s13045-015-0162-0. [DOI] [PMC free article] [PubMed] [Google Scholar]
- 19.Ganju A, Khan S, Hafeez BB, Behrman SW, Yallapu MM, Chauhan SC, Jaggi M. miRNA nanotherapeutics for cancer. Drug Discov Today. 2017;22:424–432. doi: 10.1016/j.drudis.2016.10.014. [DOI] [PMC free article] [PubMed] [Google Scholar]
- 20.Mishra S, Yadav T, Rani V. Exploring miRNA based approaches in cancer diagnostics and therapeutics. Crit Rev Oncol Hematol. 2016;98:12–23. doi: 10.1016/j.critrevonc.2015.10.003. [DOI] [PubMed] [Google Scholar]
- 21.Li T, Li M, Xu C, Xu X, Ding J, Cheng L, Ou R. miR-146a regulates the function of Th17 cell differentiation to modulate cervical cancer cell growth and apoptosis through NF-kappa B signaling by targeting TRAF6. Oncol Rep. 2019;41:2897–2908. doi: 10.3892/or.2019.7046. [DOI] [PubMed] [Google Scholar]
- 22.Roy S, Hooiveld GJ, Seehawer M, Caruso S, Heinzmann F, Schneider AT, Frank AK, Cardenas DV, Sonntag R, Luedde M, Trautwein C, Stein I, Pikarsky E, Loosen S, Tacke F, Ringelhan M, Avsaroglu SK, Goga A, Buendia MA, Vucur M, Heikenwalder M, Zucman-Rossi J, Zender L, Roderburg C, Luedde T. microRNA 193a-5p regulates levels of nucleolar- and spindle-associated protein 1 to suppress hepatocarcinogenesis. Gastroenterology. 2018;155:1951–1966. e26. doi: 10.1053/j.gastro.2018.08.032. [DOI] [PMC free article] [PubMed] [Google Scholar]
- 23.Mamoori A, Wahab R, Islam F, Lee K, Vider J, Lu CT, Gopalan V, Lam AK. Clinical and biological significance of miR-193a-3p targeted KRAS in colorectal cancer pathogenesis. Hum Pathol. 2018;71:145–156. doi: 10.1016/j.humpath.2017.10.024. [DOI] [PubMed] [Google Scholar]
- 24.Huang Y, Luo H, Li F, Yang Y, Ou G, Ye X, Li N. LINC00152 down-regulated miR-193a-3p to enhance MCL1 expression and promote gastric cancer cells proliferation. Biosci Rep. 2018;38 doi: 10.1042/BSR20171607. [DOI] [PMC free article] [PubMed] [Google Scholar] [Retracted]
- 25.Donato R, Sorci G, Giambanco I. S100A6 protein: functional roles. Cell Mol Life Sci. 2017;74:2749–2760. doi: 10.1007/s00018-017-2526-9. [DOI] [PMC free article] [PubMed] [Google Scholar]
- 26.Joo JH, Kim JW, Lee Y, Yoon SY, Kim JH, Paik SG, Choe IS. Involvement of NF-kappaB in the regulation of S100A6 gene expression in human hepatoblastoma cell line HepG2. Biochem Biophys Res Commun. 2003;307:274–280. doi: 10.1016/s0006-291x(03)01199-9. [DOI] [PubMed] [Google Scholar]
- 27.Króliczak W, Pietrzak M, Puzianowska-Kuznicka M. P53-dependent suppression of the human calcyclin gene (S100A6): the role of Sp1 and of NFkappaB. Acta Biochim Pol. 2008;55:559–570. [PubMed] [Google Scholar]
- 28.Duan L, Wu R, Zou Z, Wang H, Ye L, Li H, Yuan S, Li X, Zha H, Sun H, Zhang Y, Chen X, Zhou L. S100A6 stimulates proliferation and migration of colorectal carcinoma cells through activation of the MAPK pathways. Int J Oncol. 2014;44:781–790. doi: 10.3892/ijo.2013.2231. [DOI] [PubMed] [Google Scholar]
- 29.Mamoori A, Wahab R, Islam F, Lee K, Vider J, Lu CT, Gopalan V, Lam AK. Clinical and biological significance of miR-193a-3p targeted KRAS in colorectal cancer pathogenesis. Hum Pathol. 2018;71:145–156. doi: 10.1016/j.humpath.2017.10.024. [DOI] [PubMed] [Google Scholar]
- 30.Xie F, Hosany S, Zhong S, Jiang Y, Zhang F, Lin L, Wang X, Gao S, Hu X. MicroRNA-193a inhibits breast cancer proliferation and metastasis by downregulating WT1. PLoS One. 2017;12:e0185565. doi: 10.1371/journal.pone.0185565. [DOI] [PMC free article] [PubMed] [Google Scholar]
- 31.Gao X, Tang RX, Xie QN, Lin JY, Shi HL, Chen G, Li ZY. The clinical value of miR-193a-3p in non-small cell lung cancer and its potential molecular mechanism explored in silico using RNA-sequencing and microarray data. FEBS Open Bio. 2018;8:94–109. doi: 10.1002/2211-5463.12354. [DOI] [PMC free article] [PubMed] [Google Scholar]
- 32.Bao L, Diao H, Dong N, Su X, Wang B, Mo Q, Yu H, Wang X, Chen C. Histone deacetylase inhibitor induces cell apoptosis and cycle arrest in lung cancer cells via mitochondrial injury and p53 up-acetylation. Cell Bio Toxicol. 2016;32:469–482. doi: 10.1007/s10565-016-9347-8. [DOI] [PMC free article] [PubMed] [Google Scholar]
- 33.Jeong MH, Ko H, Jeon H, Sung GJ, Park SY, Jun WJ, Lee YH, Lee J, Lee SW, Yoon HG, Choi KC. Delphinidin induces apoptosis via cleaved HDAC3-mediated p53 acetylation and oligomerization in prostate cancer cells. Oncotarget. 2016;7:56767–56780. doi: 10.18632/oncotarget.10790. [DOI] [PMC free article] [PubMed] [Google Scholar]


