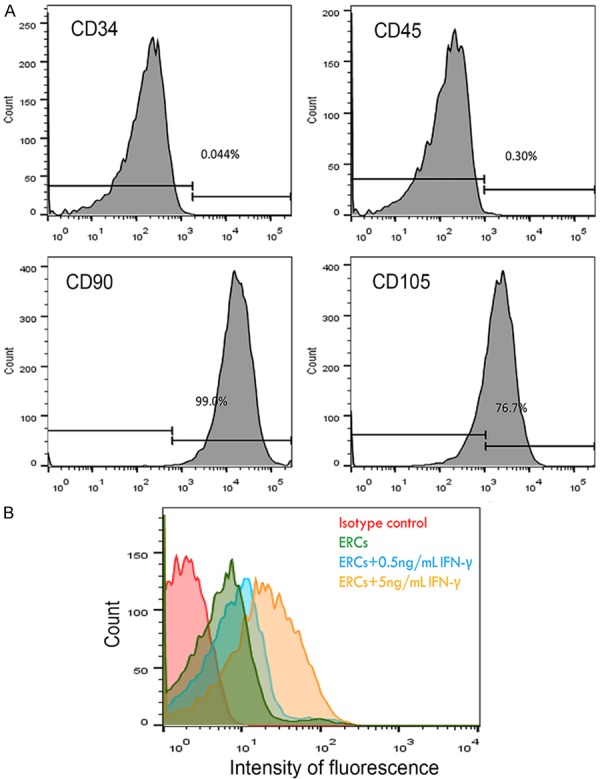
Figure 1.

A. Representative flow cytometric analysis of surface expression of phenotypic markers in ERCs. ERCs express CD105, CD90, while lacking of CD34, CD45. B. PD-L1 expression of ERCs was analyzed by using the FACS. Basal PD-L1 levels were found on ERCs and dose-dependently increased with the IFN-γ concentration (0.5-5 ng/mL). The result was representative in three separate experiments.
