Figure 2.

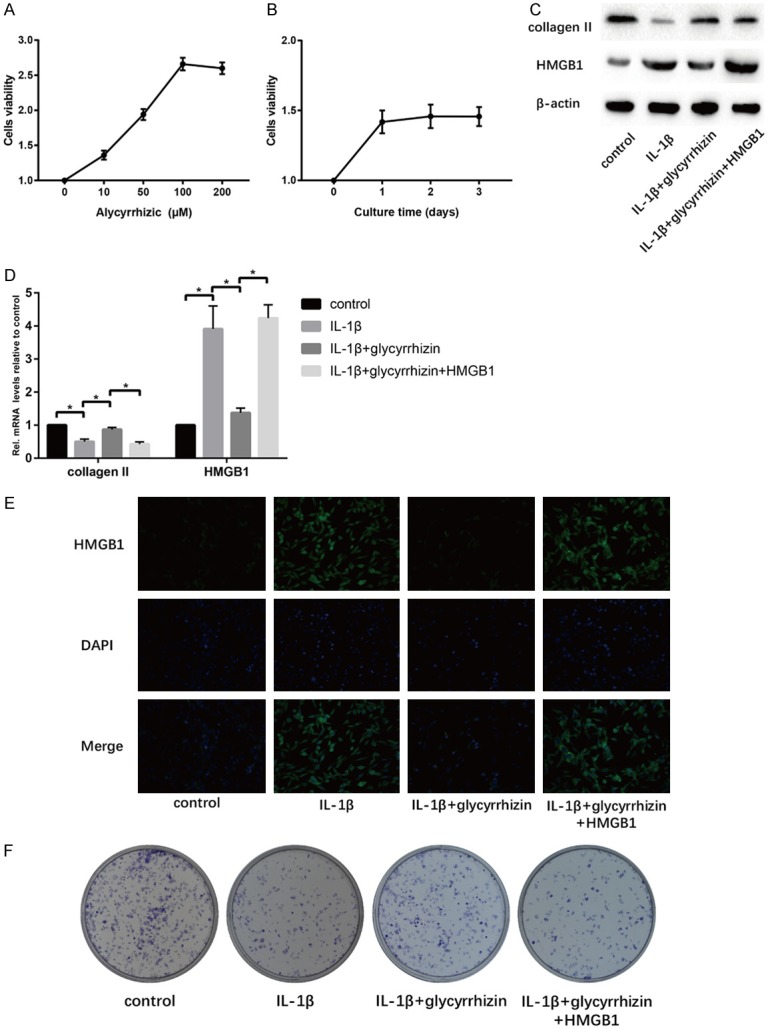
Effect of GL treatment on IL-1β-induced senescent NP cells in vitro. A. Cells were treated with GL (0, 10, 50, 100, 200 μM) for 24 h. Viability was determined by CCK8 assay. B. Cells were treated with GL (100 μM) for various time (0, 1, 2, 3 d). Viability was determined by CCK8 assay. C. Results of protein expression of collagen II, HMGB1 and β-actin in four groups were determined by Western blotting. D. Results of mRNA expression of collagen II and HMGB1 in four groups were determined by RT-PCR. E. Cell IF was performed to determine the expression of HMGB1 in cells of the four groups. F. Cell proliferation was analyzed by colony formation assay in four groups (“*” means there is a statistical difference with the two groups, P value < 0.05).
