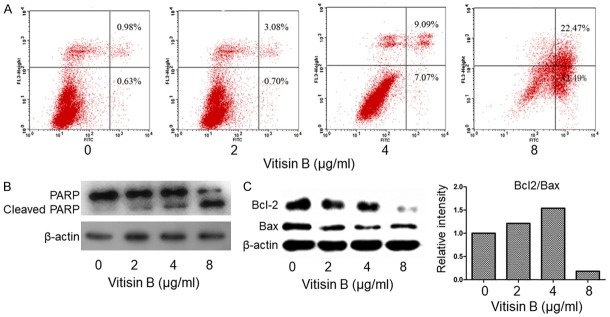
Figure 3.
Apoptotic effect of vitisin B on MDA-MB-231 cells. A. Apoptosis was evaluated using an annexin V-FITC apoptosis detection kit and flow cytometry. The X- and Y-axes represent annexin V-FITC staining and PI staining, respectively. The representative pictures were from MDA-MB-231 cells incubated with different concentrations of vitisin B (0, 2, 4 and 8 µg/ml). The gate setting distinguished between living (bottom left), necrotic (top left), early apoptotic (bottom right), and late apoptotic (top right) cells. The experiment was repeated three times. B. Vitisin B induced apoptosis in MDA-MB-231 cells as assessed by PARP cleavage (note intact PARP at 116 kDa and its cleavage product at 89 kDa). Shown gels were representative of those obtained from at least three independent experiments. C. The expression levels of Bcl-2 and Bax were down-regulated after treatment with vitisin B. Shown gels were representative of those obtained from at least three independent experiments.

