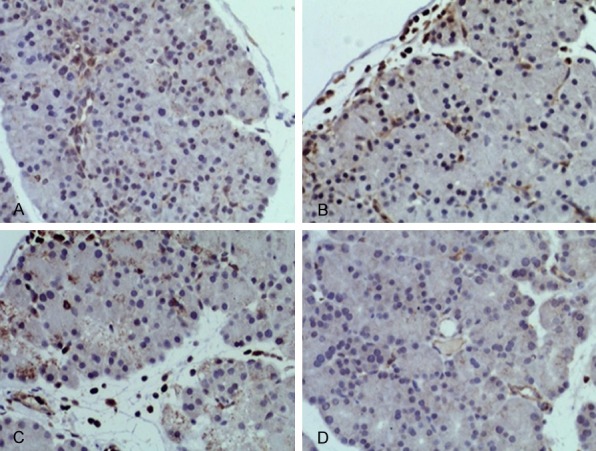
Figure 6.

ROCK I IHC staining in pancreatic tissues at 24 h (DAB staining, ×200). Pancreatic tissues were collected, fixed and embedded in paraffin followed by antigen-retrieval and blocking followed by measuring the expression of ROCK I by IHC staining. A. 24 h of BMSCs-SAP group; B. 24 h of Y-27362-SAP group; C. 24 h of SAP group; D. 24 h of control group.
