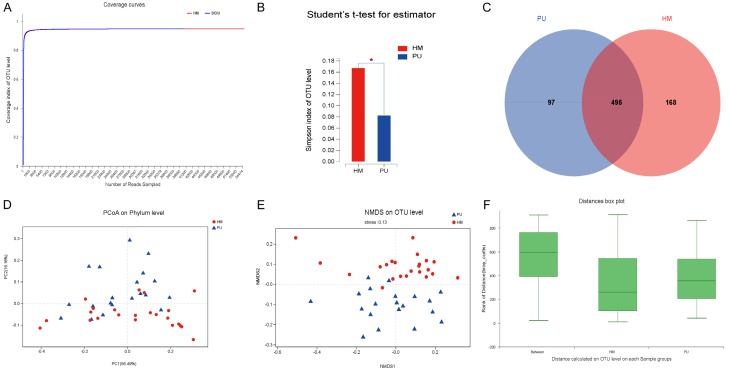
Figure 1.
Diversity and taxonomic analysis in the health male and cervical SCI groups. A. The rarefaction curves showed clear asymptotes and the Good’s coverage for the observed OTUs was 99.8% in the health male and cervical SCI groups. B. OTU diversity index Simpson showed a significant difference between the health male and cervical SCI groups (Student’s t test, P = 0.017). C. A Venn diagram demonstrated 495 of the total 760 OTUs were shared between the health male and cervical SCI groups. D. The PCoA on phylum level of beta-diversity analysis showed there was significant difference in bacterial community composition between two groups (PCoA, PC1 = 56.49%; PC2 = 16.16%). E. The NIMDS on OTU level of beta-diversity analysis showed there was significant difference in bacterial community composition between two groups (NIMDS, stress = 0.13). F. ANOSIM/Adonis revealed significant differences in the structure of gut microbiota among the two groups (ANOSIM, r2 = 0.4532, P = 0.001).

