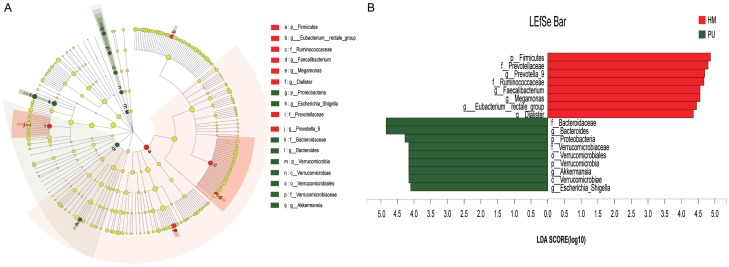
Figure 3.
Cladogram showing differentially abundant taxa of microbiota between health male and cervical SCI groups. A. LEfSe cladogram showed the most differentially abundant taxa of 16S sequences between the two groups. B. LEfSe analysis (LDA threshold of 4) indicated that Bacteroidaceae and Bacteroides were significantly enriched in the SCI group compared with the healthy group, which showed enrichment of Firmicutes and Prevotellaceae (Kruskal-Wallis (KW) sum-rank test).

