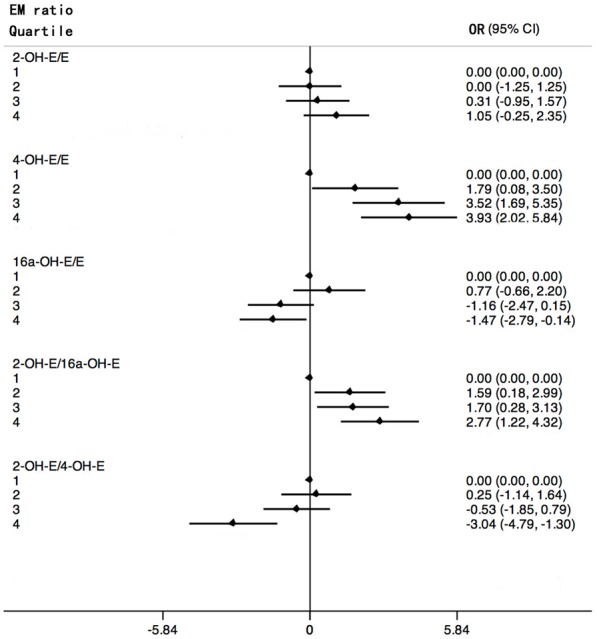
Figure 1.

Forest plots of odd ratios (in natural logarithm) for breast cancer and 95% confidence intervals (in natural logarithm) by quartiles of estrogen metabolites ratios. ORs (black rhombus) are shown on a In scale. Black lines represent 95% CIs. Quartiles are abbreviated 1, 2, 3, 4.
