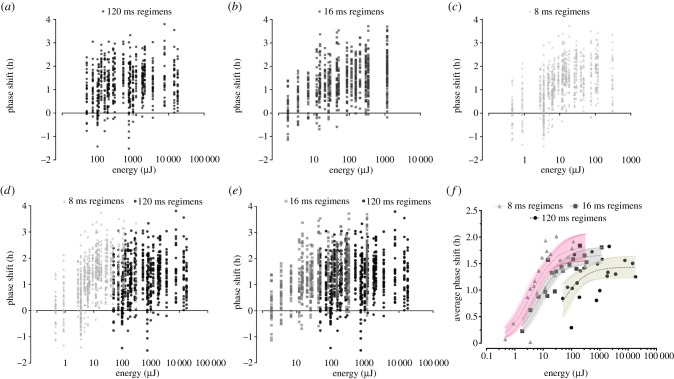
Figure 1.
Phase shifts of locomotor activity (h) are quantified for individual flies (n = 2199) stimulated with one of the 64 blue LED protocols for 15 min starting at ZT13, 1 h after lights-off on the last day of the light–dark schedule (12 L : 12 D, lights-on at 01.00 h, MST). Protocols employed 120 ms (a), 16 ms (b) or 8 ms flashes (c). Note that any colour variations within (a–c) result from the overlay of semi-transparent data points (i.e. darker areas reflect the concentration of more data in the scatter plot). (d,e) Individual data from the 120 ms and 8 or 16 ms flash conditions are reproduced/superimposed to facilitate visual comparisons between the regimens. (f) Averaged data from each family of protocols are plotted against one another, fitted with three-parameter dose–response curves (dotted lines) and overlaid with prediction bands reflecting the 95% confidence intervals for the fits (8 ms = pink; 16 ms = grey; 120 ms = beige). (Online version in colour.)

