Figure 2.
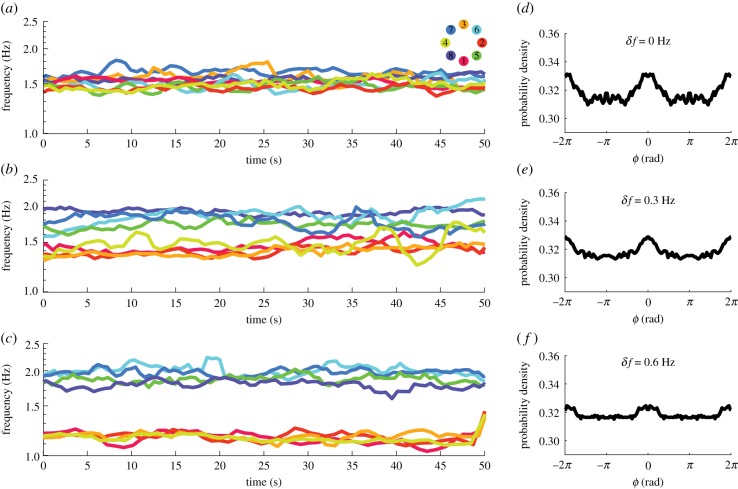
Social coordination behaviour observed in the Human Firefly experiment in terms of frequency dynamics and aggregated relative phase distributions. Panels (a–c) show instantaneous frequency (average over four cycles) from three example trials with diversity δf = 0, 0.3, 0.6 Hz, respectively. Viewed from bottom to top, in (c), two frequency groups of four are apparent and isolated due to high intergroup difference (low-frequency group, warm colours, paced with metronome fA = 1.2 Hz; high-frequency group, cold colours, paced with metronome fB = 1.8 Hz). As the two groups get closer (b), more cross-talk occurred between them (note contacting trajectories especially after 30 s). Finally, when the intergroup difference is gone (a), one supergroup of eight formed. Panels (d–f) show relative phase ϕ distributions aggregated from all trials for δf = 0, 0.3, 0.6 Hz, respectively (each distribution was computed from the set of all pair-wise relative phases at all time points in all trials for a given diversity condition; histograms computed in [0, π), plotted in [− 2π, 2π] to reflect the symmetry and periodicity of relative phase distributions). When diversity is low (d), the distribution peaks near inphase (ϕ = 0) and antiphase (ϕ = π), separated by a trough near π/2, with antiphase weaker than inphase. The two peaks are diminished as δf increases (e,f), but the weaker one at antiphase becomes flat first (f). (Online version in colour.)

