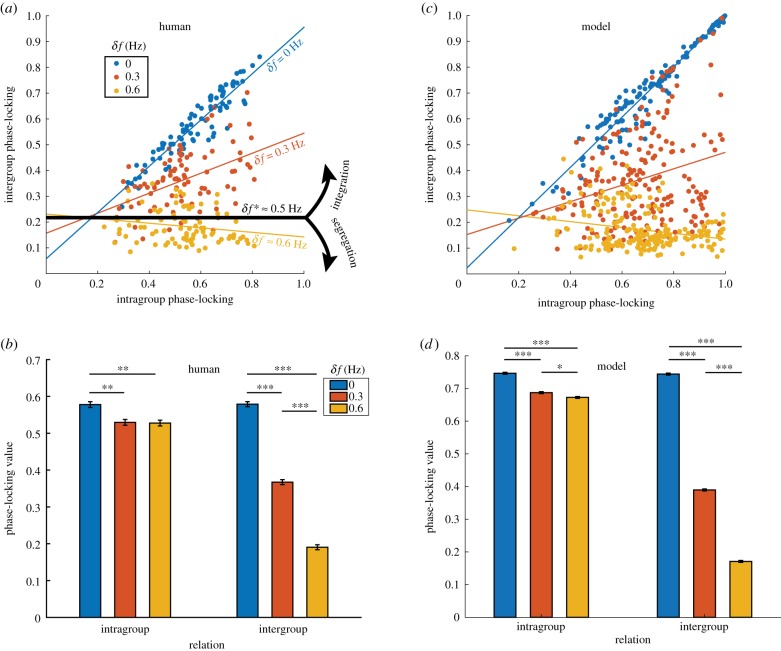
Figure 3.
Comparison between human and model behaviour at intragroup and intergroup levels. (a) How intragroup coordination relates to intergroup coordination for different levels of diversity (δf, colour-coded) in the ‘Human Firefly’ experiment [24]. Each dot’s x- and y-coordinate reflect the level of intragroup and intergroup coordination, respectively (measured by phase-locking value; see text) for a specific trial. Lines of corresponding colours are regression lines fitted for each diversity condition (slope β1 indicates the level of integration between groups). With low and moderate diversity (blue and red), two frequency groups are integrated (positive slopes); and with high diversity (yellow), two frequency groups are segregated (negative slope). Black line (zero slope) indicates the empirically estimated critical diversity δf*, demarcating the regimes of intergroup integration and segregation. The exact same analyses applied to the simulated data (200 trials per diversity condition) and results are shown in (c), which highly resemble their counterparts in (a). (b) A break-down of the average level of dyadic coordination as a function of diversity (colour) and whether the dyadic relation was intragroup (left) or intergroup (right). Intragroup coordination was reduced by the presence of intergroup diversity (δf ≠ 0; left red, yellow bars shorter than left blue bar); intergroup coordination dropped rapidly with increasing δf (right three bars; error bars reflect standard errors). Results of the same analyses on simulated data are shown in (d), which again highly resemble those of the human data in (b). (Online version in colour.)

