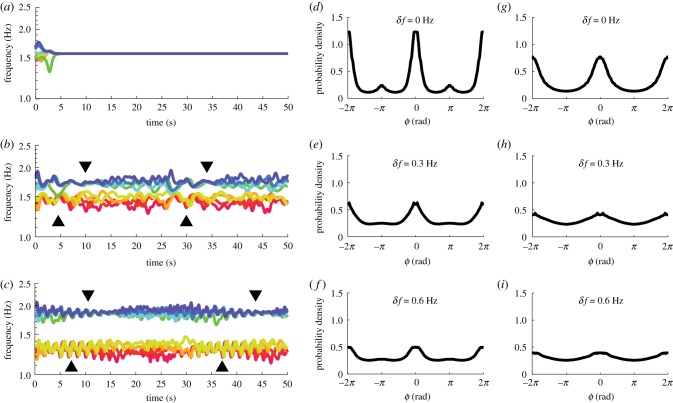
Figure 5.
Model simulations of frequency dynamics and aggregated relative phase distributions. (a–c) An example of how intergroup difference may affect intragroup coordination using frequency dynamics of three simulated trials (a = b = 0.105; note that frequency is the time derivative of phase divided by 2π, and consequently the distance between two frequency trajectories reflects the rate of change of the corresponding relative phase, which increases and decreases intermittently during metastable coordination). These three trials share the same initial phases and intragroup frequency dispersion but different intergroup difference i.e. δf = 0, 0.3, 0.6 Hz, respectively. When intergroup differences are introduced (b,c), not only is intergroup interaction altered but intragroup coordination also loses stability and becomes metastable (within-group trajectories converge at black triangles and diverge afterwards). The timescale of metastable coordination also changes with δf, i.e. the inter-convergence interval is shorter for (b) than (c). (d–f) Relative phase distributions, aggregated over all time points in 200 trials (a = b = 0.105) for each diversity condition (δf = 0, 0.3, 0.6, respectively). At low diversity (d), there is a strong inphase peak and a weak antiphase peak, separated by a trough near π/2. Both peaks are diminished by increasing diversity (e,f). These features match qualitatively the human experiment. (g–i) The same distributions as (d–f) but for a = 0.154 and b = 0 (i.e. the classical Kuramoto model). There is a single peak in each distribution at inphase ϕ = 0, and a trough at antiphase ϕ = π. (Online version in colour.)

