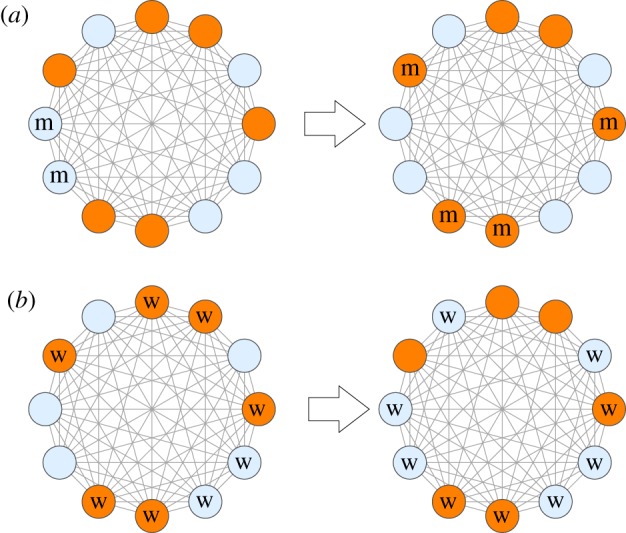
Figure 6.

A schematic showing possible evolutionary paths where cells occupy spots that are favourable for them (the case of the complete graph). Here dark orange circles denote spots that are favourable for mutants and light blue circles—spots favourable for wild-type cells. (a) The locations of mutants are marked by ‘m’, the rest of the spots are assumed to be occupied by wild-type cells. Minority mutant cells expand and occupy favourable spots. (b) The majority wild-type cells are denoted by ‘w’. As they expand, it is impossible for them to redistribute in such a way that they only occupy favourable spots (because there are more wild-type cells than such spots). In general, it is easier for minority cells to explore fitness configurations in their favour compared to majority cells. (Online version in colour.)
