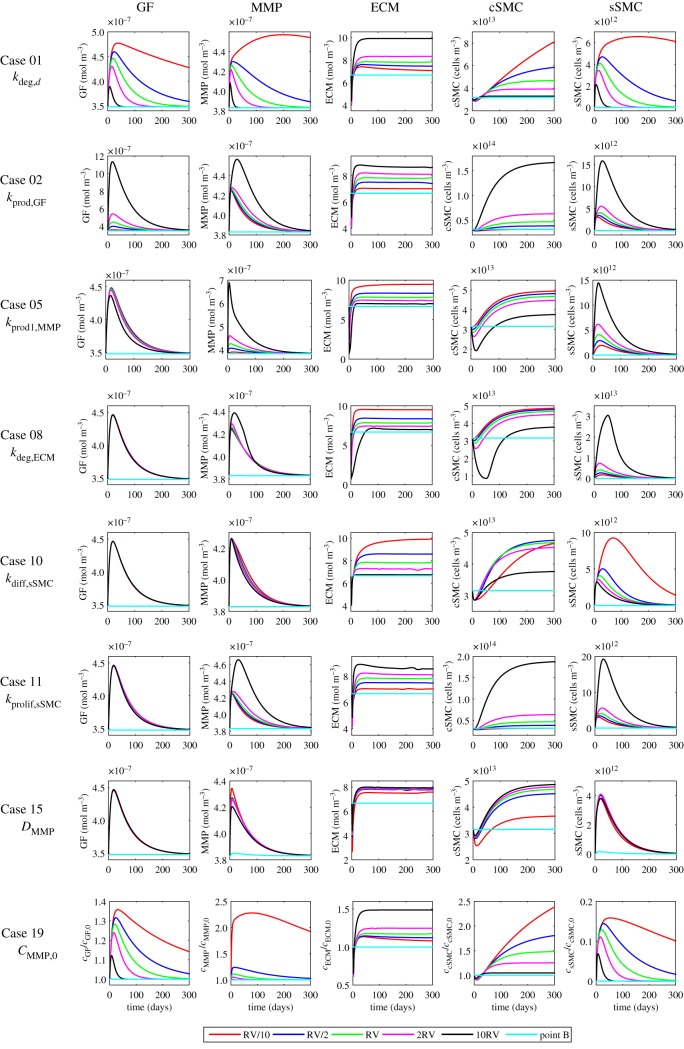
Figure 10.
Key results from the sensitivity analysis. The plots show the effect of varying several parameters on the concentration of GFs, MMPs and ECM as well as the density of contractile and synthetic SMCs for eight different cases. Computations were carried out for four different values for each parameter apart from the reference value, RV, which is shown in table 3. The values of 2RV and RV/2 were considered ± half the RV of the selected parameter; 10RV and RV/10 were given by increasing and decreasing by one order of magnitude the RV (table 4). The results shown for point B correspond exclusively to the RV (baseline model). Refer to the electronic supplementary material for a discussion. (Online version in colour.)

