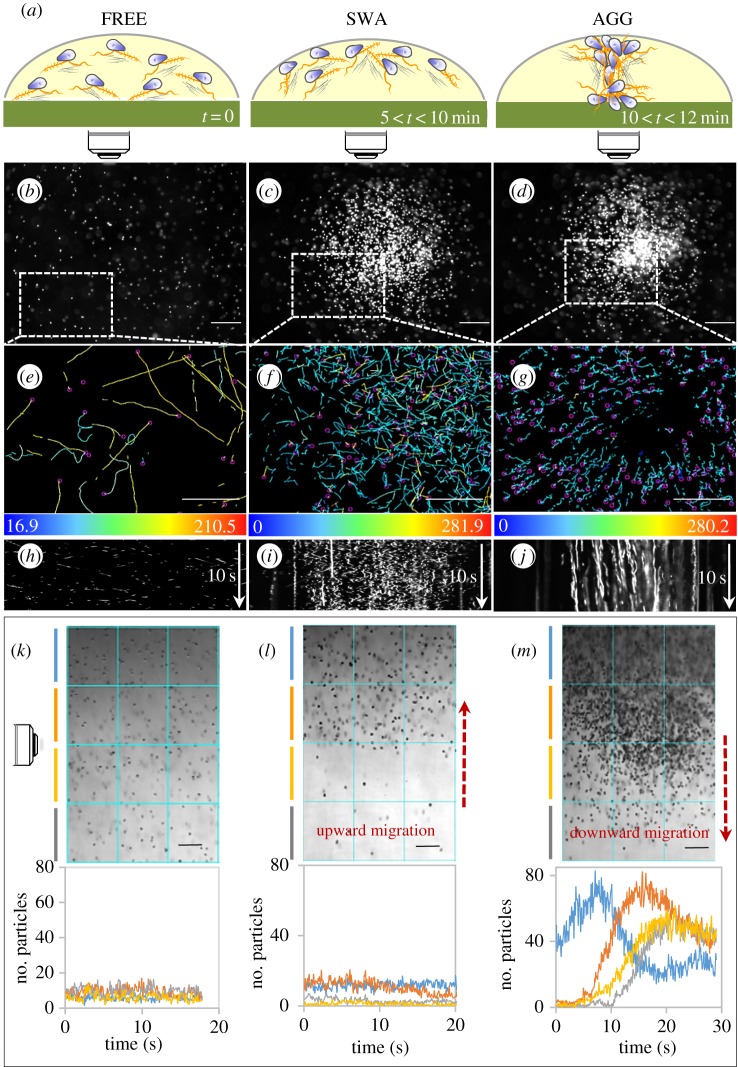
Figure 2.
Zoospore motion in droplets in response to K+ application. (a) Summary scheme of the distribution and displacement of the cell population in three different defined states: FREE for zoospores swimming freely and distributed randomly before gradient sensing; SWA and AGG for zoospores forming a swarm and aggregating, respectively, upon gradient sensing. The range is indicative of the time at which each sequence occurred after KCl application. (b–j) Patterns observed in the horizontal plane for zoospore distribution (b–d), swimming paths (e–g) and two-dimensional kymographs drawn for 10 s (h–j). The kymographs provide a picture of the variation of zoospore behaviour in the three states, from highly motile cells, appearing as oblique lines (h), to more static cells, represented by vertical lines (j). Swimming paths were recorded for x,y coordinates corresponding to the areas delimited by dotted rectangles in (b,c,d) for 2 s for (e,f) or 4 s for (g). The colour coding provides information about mean velocity with range-limiting values indicated at the bottom of each inset in µm s−1. On the kymograph image, the vertical axis represents time (white arrow), the horizontal axis corresponds to the intensity of the pixel along the length of the selected line: a linear region of interest of 1500 µm located at the centre of the field along the x axis. (k–m) The distribution and displacement patterns observed in the vertical plane. The upper insets show representative micrographs for the FREE, SWA and AGG states. For each state, the lower insets show plots of zoospore number per unit area versus time, at each depth identified by the colour code defined in the upper insets. The SWA state is associated with an upward migration (signified by an ascending red arrow), whereas AGG is associated with a downward migration (descending red arrow). The bidirectional and sequential movement of the cell population results in a five- to sevenfold increase in local cell density during downward migration (compare (k) with (m)). The zoospore numbers presented are means calculated from three consecutive unit areas and are based on counts of particles of 3–30 µm in diameter on converted binary images. Bar sizes: 100 µm. (Online version in colour.)

