Figure 3.

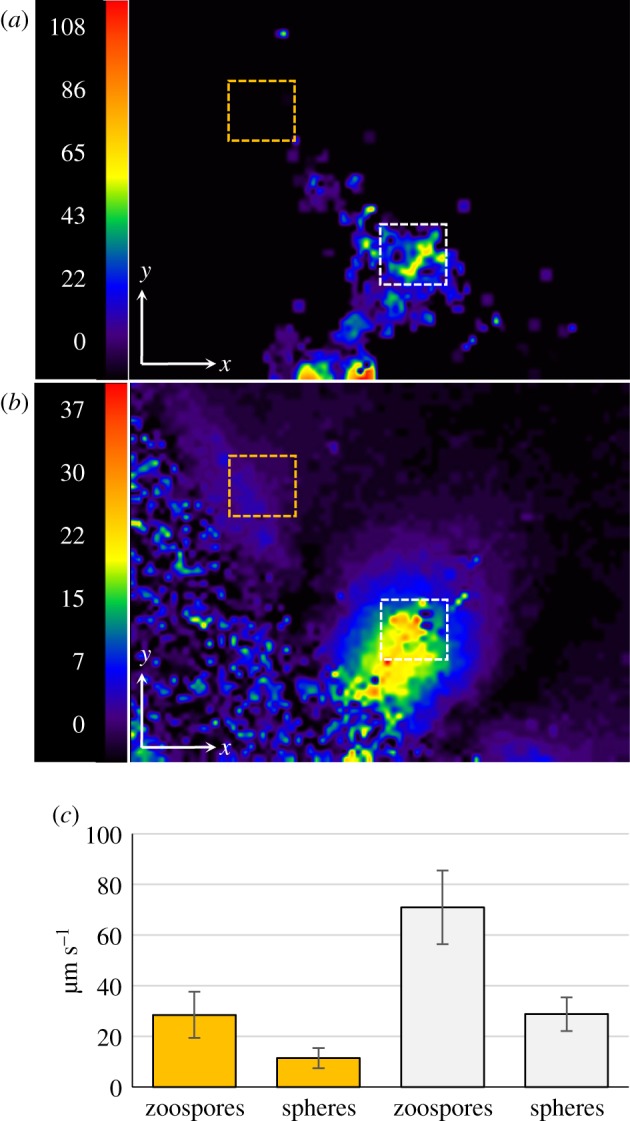
Flow field of the water and velocity field of zoospores within a plume. The flow field was analysed by adding fluorescent microspheres (Φ 0.5 µm; 1/1000, v/v) to the cell suspension. One representative instance of a zoospore swimming within a plume was visualized in the horizontal plane (electronic supplementary material, movie S7). The movement of zoospores was captured by dark-field microscopy during the first 6 s of the sequence. The movement of fluorescent microspheres was then captured for 5 s by switching to fluorescence microscopy with a rhodamine fluorescence filter set. (a) A vector magnitude plot of velocity fields, defined by the PIV of zoospore movement and generated between t = 5 s and t = 6 s. (b) The vector magnitude plot of the microsphere movement was generated between t = 7 s and t = 8 s, 1 s after the switch from dark-field to fluorescence microscopy. The colour code indicates the magnitude of velocity (μm s−1). (c) Histogram of the mean velocity of zoospores and microspheres determined from areas located outside (dotted yellow square in (a) and (b)) or within (dotted white squares in (a) and (b)) the plume. The difference between the values determined within and outside the plume was highly significant for both particles in Student's t-test (p < 0.0001). (Online version in colour.)
