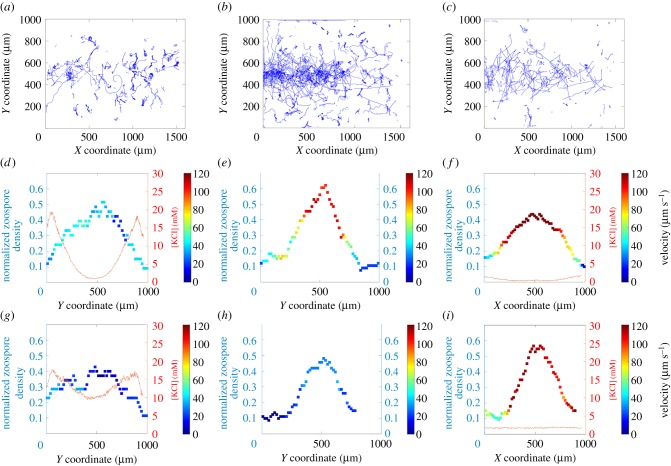
Figure 6.
Trajectories, density profiles and the speed of the zoospores in the chamber, according to potassium concentration profile. Trajectories of the zoospores throughout the entire chamber after the flushing out of KCl for a time T equal to 5 s (a), 10 s (b) and 15 s (c, only 1/10th of the trajectories are shown for the sake of simplicity). (d–f) Local density of zoospores (squares) with a colour map for the associated velocity, and the potassium profile (red lines), the flushing out of KCl for 4 s. (g–i) Same representations after 16 s of KCl flushing. (Online version in colour.)

