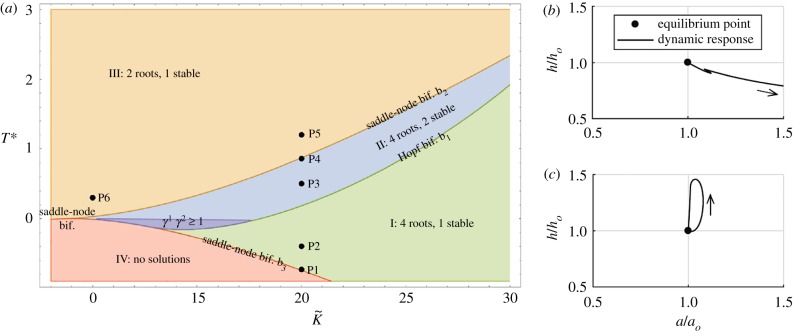
Figure 5.
Mechanobiological stability. Phase diagram (a) showing distinct regions with different equilibrium states and stability behaviours for a growing tubular structure as a function of its homeostatic stress and anisotropy [97]. Phase-plane-type plots (b,c) showing both unstable, for a low value of a parameter governing the rate of matrix synthesis (b), and asymptotically stable, for a higher value of this parameter (c), growth and remodelling responses of an artery (normalized wall thickness h versus luminal radius a) following a transient perturbation in blood pressure [98]. (Online version in colour.)

