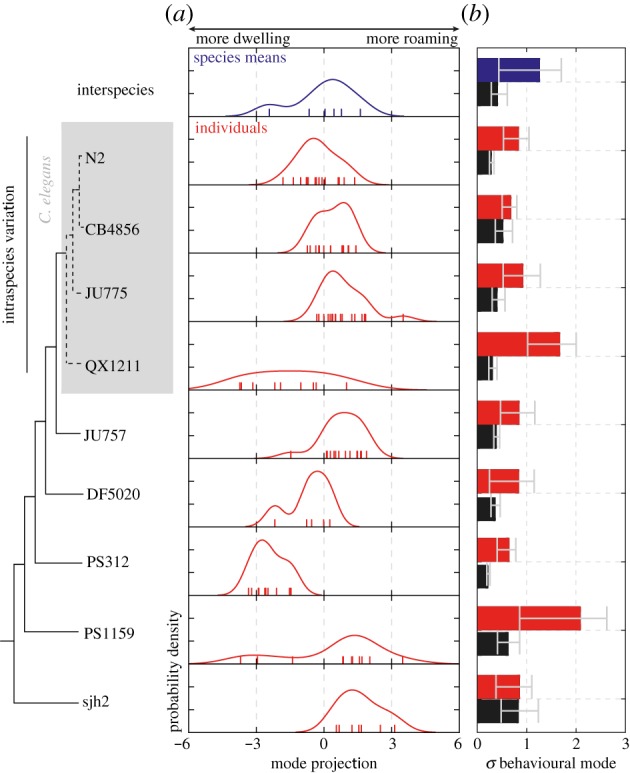
Figure 6.

Variation of model parameters reveal specialized and diversified behavioural strategies across strains. (a) Distribution of the average phenotype for each species (interspecies variation, blue) or individuals within a strain (red). Note that the variation of individual phenotypes in some strains (e.g. QX1211, PS1159) is comparable in magnitude to that of interspecies variation. Observations are indicated with coloured ticks. (b) Comparison of the width of the phenotype distributions (coloured bars), quantified as the bootstrapped standard deviation of the data points in (a), with the uncertainty in the determination of the phenotype (black bars), quantified as the standard deviation of individual phenotype determinations over bootstrapped 100 s time windows. Error bars correspond to 95% confidence intervals across bootstrap samples. (Online version in colour.)
