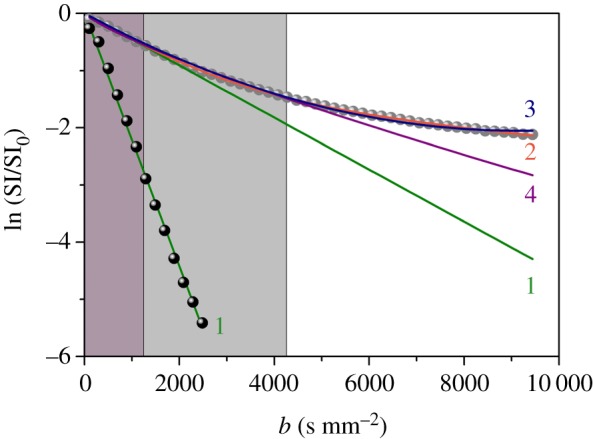
Figure 1.

Signal decay of the RH (grey symbols) and free Milli-Q water (black symbols), normalized to the signal decay at b = 0.5 s mm−2 and averaged over three orthogonal gradient directions. The curves represent the fits using different diffusion models: mono-exponential decay (1, equation (A 1)), bi-exponential decay (2, equation (A 2)), kurtosis excess (3, equation (A 3)), stretched exponential decay (4, equation (A 5)). The grey areas represent the regions where the mono-exponential (dark grey) and the stretched exponential (light grey) fits reproduce the experimental data with good agreement. (Online version in colour.)
