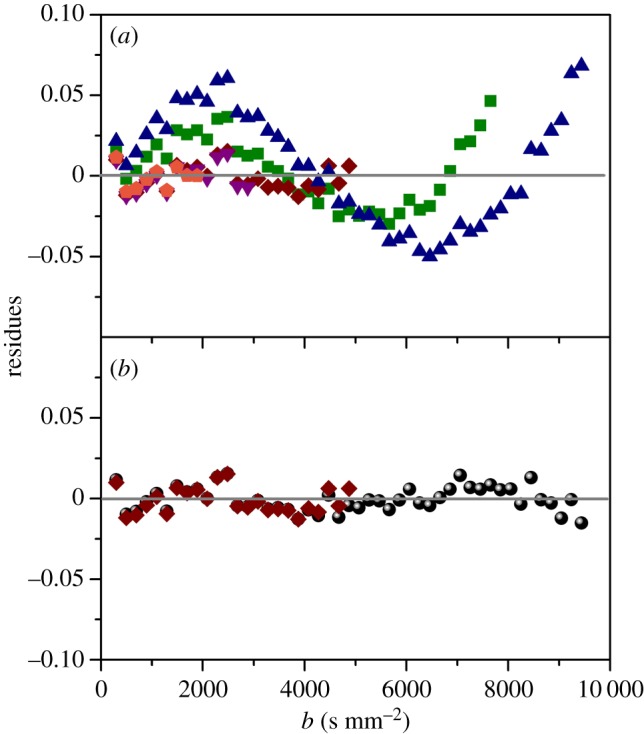
Figure 2.

(a) Residues of the RH calculated from the fit using the kurtosis model. The different symbols represent the fits using bmax = 2000 s mm−2 (pentagons), 3000 s mm−2 (down triangles), 5000 s mm−2 (diamonds), 7600 s mm−2 (squares) and 10000 s mm−2 (triangles). (b) Comparison between the residues estimated using the kurtosis (with bmax = 5000 s mm−2, diamonds) and the bi-exponential (circles) models. (Online version in colour.)
