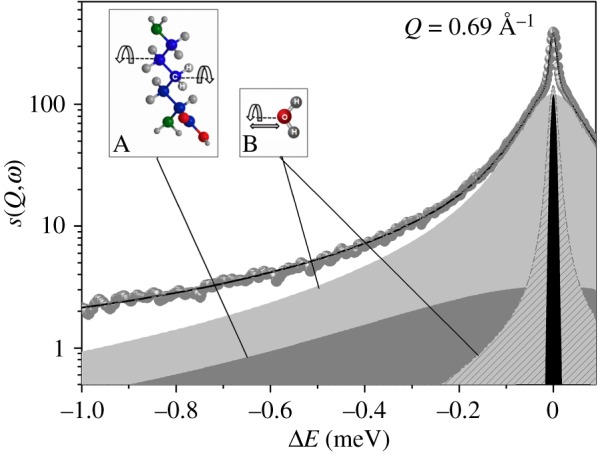
Figure 5.

Example of a QENS spectrum at Q = 0.69 Å−1 measured on IN5 at 300 K. Symbols = experimental data; solid line = total fit; black = elastic peak; dark grey = broad Lorentzian SCH2(Q,ω); light grey = bulk-like water (fast) component; grey pattern = restricted water (slow) component. Both fast and slow components are convolutions of translational and rotational diffusion scattering functions. Inset A: typical rotational motion of CH2 groups observed in protein amino acids and lipids; inset B: rotational and translational motions experienced by water molecules. (Online version in colour.)
