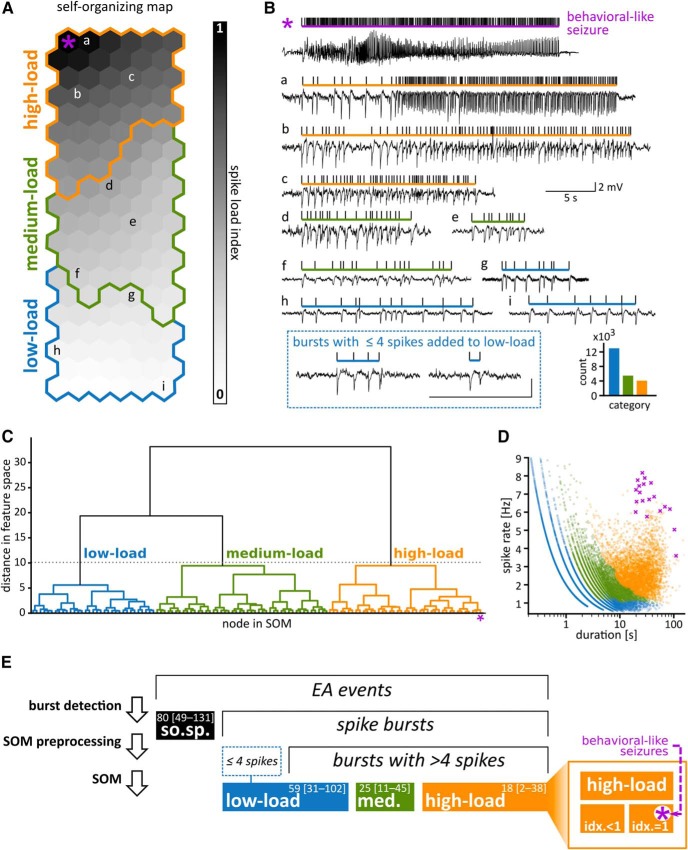
Figure 2.
Classification of epileptic bursts. A, A SOM was used to transform burst features (number of spikes in a burst, median interspike interval, SD of interspike intervals) into a spike load index. Each node (hexagon) represents a combination of features. Bursts were assigned to nodes that match their features best (letters refer to the examples shown in B). The spike load index (gray scale) captures the proximity to the node containing the bursts with the highest spike loads (*). Colored lines enclose nodes grouped into categories by a dendrogram analysis (see C). B, Examples of EA events after classification. Vertical ticks above the LFP traces mark individual spikes found by our detection algorithm. Horizontal bars delimit the extent of spike bursts, with color indicating the category assigned to the burst. Lower case letters (a–i) refer to their placement on the SOM. Bursts with less than five spikes were not classified on the SOM and later added to the category low-load bursts. The inset shows how many bursts of each category were present in the dataset. Participation of the contralateral DG and ipsilateral EC varied for bursts of different categories (Extended Data Figure 2-2). C, Nodes of the SOM were hierarchically clustered using Ward’s dendrogram method (Ward, 1963). To create the dendrogram, nodes were successively merged according to their proximity in feature space. The y-axis shows the distance in feature space between merges. The gray dotted line indicates the threshold used to obtain the three categories as suggested by Thorndike’s criterion (Extended Data Figure 2-1). D, Spike rate against duration of bursts. Each dot marks one burst and is colored according to its category. Bursts of the same duration or spike rate can belong to different categories. Purple crosses mark visually identified, putative behavioral seizures. E, Overview of terminology and event rates. The population of EA events had been split into spike bursts and solitary spikes (so.sp.) by burst detection (Fig. 1). Bursts with more than four spikes were classified using a SOM (A) and subsequent hierarchical clustering (C), resulting in three main categories. The category high-load bursts included events with the highest spike load index (idx. = 1; inset). Seizures that had been identified visually beforehand all scored spike load index = 1 in the SOM. Numbers indicate median and 10th–90th percentile range of event counts per hour across sessions (N = 105).

