Figure 3.
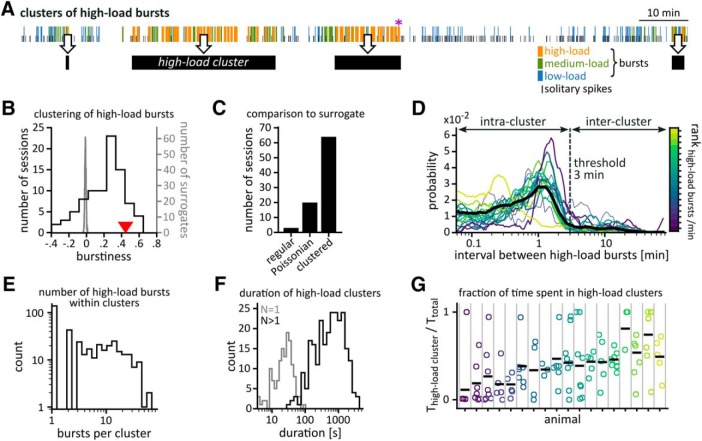
Clusters of high-load bursts. A, Sample sequence of classified EA events. The purple asterisk marks a putative behavioral seizure. Black bars below the time series indicate high-load clusters defined according to D. Our definition allowed for high-load clusters to consist of a single high-load burst. B, Burstiness calculated from the intervals between all high-load bursts in the full dataset (value marked by red triangle) and for each session separately (distribution shown in black, N = 87, including only sessions with at least five intervals between high-load burst). The distribution of surrogate burstiness scores (gray) was derived from surrogate series of high-load bursts matching the rate of high-load bursts in the whole dataset (N = 1000). C, Number of sessions scoring burstiness values significantly below (“regular”), significantly above (“clustered”), or not significantly different from surrogate interval distributions. For each recording, we generated 1000 surrogate interval distributions of matching rate and compared their burstiness distribution to the original data. Significance level: α ≤ 0.05. D, The distributions of intervals between high-load bursts were used to define clusters of high-load bursts. Colored lines indicate distributions for individual animals; the average distribution across animals is shown in black. High-load bursts separated by <3 min (vertical line) were grouped into the same high-load cluster. E, Distribution of cluster size, i.e., the number of high-load bursts within high-load clusters. F, Distribution of duration of high-load clusters. Gray, high-load clusters consisting of a single high-load burst; black, clusters containing more than one high-load burst. G, Fraction of time spent in high-load clusters for all sessions (circles, colors as in D). Horizontal dashes indicate medians across recording sessions of the same mouse (separated by vertical lines).

