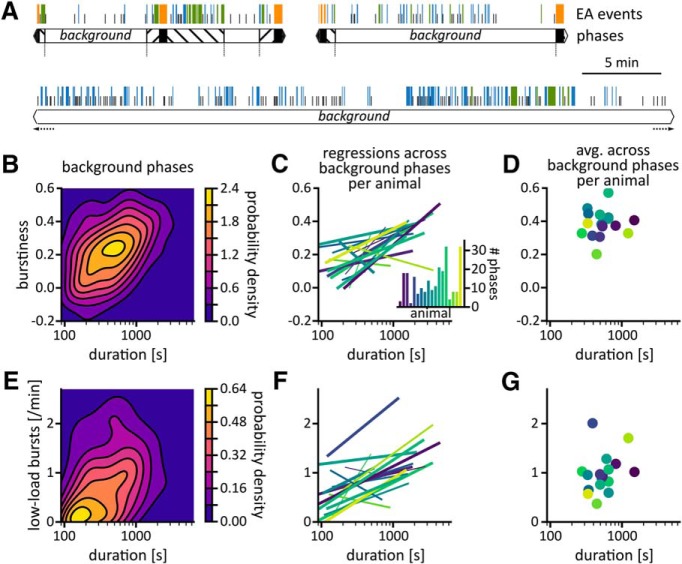
Figure 5.
Background phases with a high rate of low-load bursts last longer. A, Example sequences of EA events (colored bars: bursts; solitary spikes: black tick marks) and background phases (white boxes). B, Burstiness of spikes within a background phases against duration of that background phase. Only background phases of known duration and with at least five interspike intervals were included (N = 197, τ = 0.27, psurrogate = 0.009). C, Relation between duration and burstiness of background phases per animal. Each line shows the least-squares regression across background phases for each animal individually (same data as in E but analyzed per animal). The slopes were positive in 15 out of 18 animals. Line width indicates the number of background phases (thin: N < 5, medium: N = 5–10, thick: N > 10). Inset: Number of background phases per animal. D, Overall burstiness plotted against average duration of background phases per animal. The correlation was not significant (N = 18, τ = 0.07, psurrogate = 0.3). Note that burstiness was calculated from interspike intervals of all background phases pertaining to an animal. Hence background phases with more intervals had a greater influence on overall burstiness of an animal. Because longer background phases, i.e., those with more intervals and/or higher spike rates, scored higher burstiness, the center of mass of the burstiness distribution per animal is shifted toward higher burstiness values compared to the center of mass of the distribution per background phase shown in B. E, Correlation between duration of background phase and rate of low-load bursts during background phase. Only background phases of known duration were included (N = 240, τ = 0.28, psurrogate < 0.001). F, Relation between background rate of low-load bursts and duration of background phase per animal. Each line shows the least-squares regression across background phases for each animal individually (same data as in E but analyzed per animal). G, Correlation between average duration of background phase and average background rate of low-load bursts per animal (N = 18, τ = 0.20, psurrogate = 0.5). The slopes were positive in 15 out of 18 animals. The fraction of time spent in background phases per session/animal and the survival function of background phases are shown in Extended Data Figure 5-1. Surrogate tests based on Poissonian event trains for the relationships across background phases (B, E) and permutation tests for the relationships calculated across the set of animals (D, G) are shown in Extended Data Figure 5-2. In Extended Data Figure 5-3, we compared the correlation shown for low-load bursts (E) with correlations for spikes and solitary spikes and assessed the robustness of these correlations against changes in burst definition.

