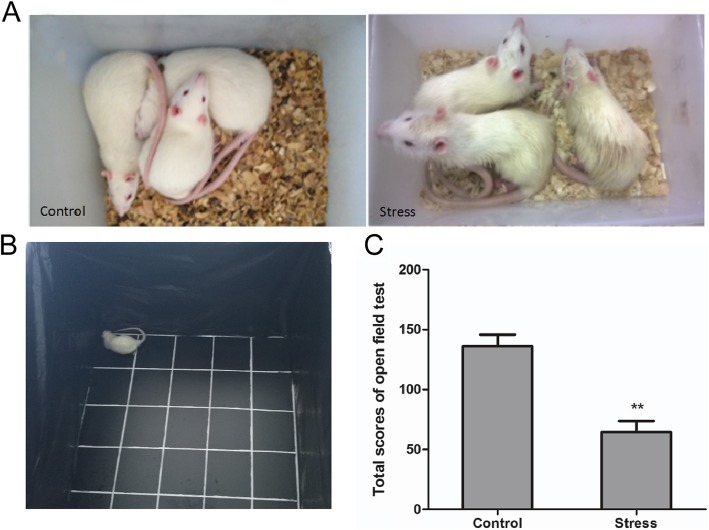
Fig. 1.
Effect of simulated transport stress on the behavior of rats according to the open-field test. Control and Stress stand for the control group and simulated transport-stress group, respectively. Effect of simulated transport stress on the behavior of rats (a) (b) and the open-field test scores in each group (c). Data are presented as mean ± SD (n = 12 rats per group). Comparisons between the groups were analyzed using Student’s t-tests. ** stands for the comparison between the control group and simulated transport stress group (P < 0.01)

