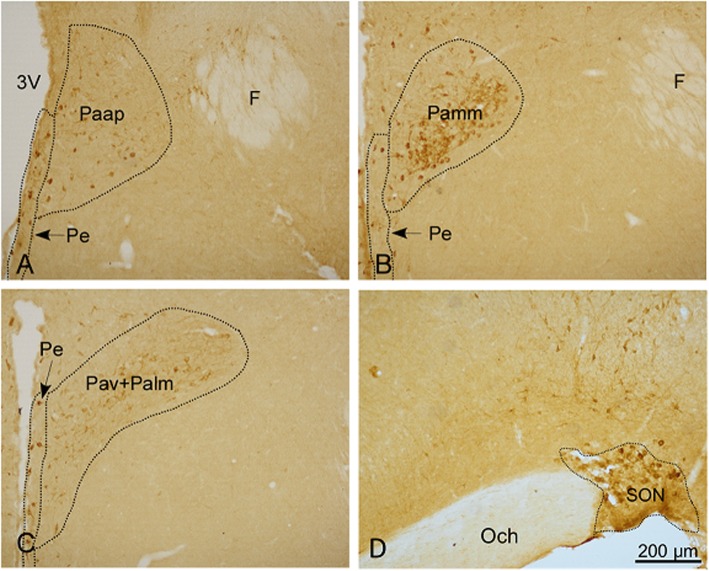
Fig. 4.
Effect of simulated transport stress on the distribution of nNOS-positive neurons in the PVN and SON. Control and Stress stand for the control group and simulated transport stress group, respectively. Effect of simulated transport stress on the distribution of nNOS-positive neurons in the Paap (a), Pamm (b), Pav + Palm (c), and SON (d)

