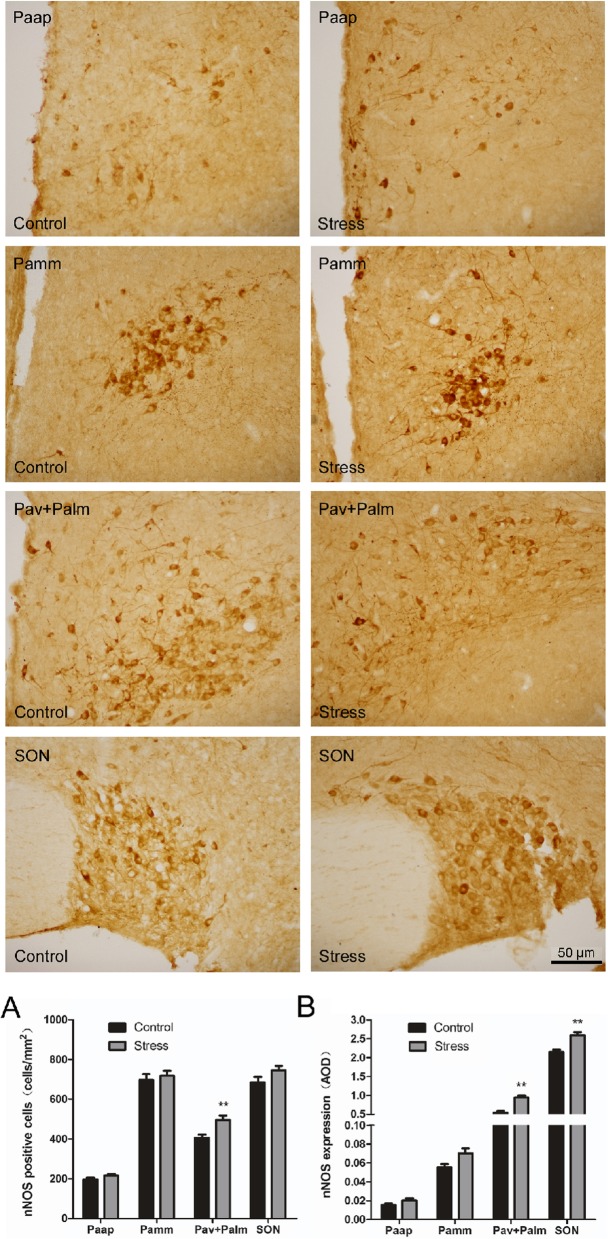
Fig. 5.
Effect of simulated transport stress on nNOS levels in the hypothalamus of rats. Control and Stress stand for the control group and simulated transport stress group, respectively. Effect of simulated transport stress on nNOS-positive cells (a) and nNOS expression (b). Data are presented as the mean ± SD (n = 6 rats per group). Comparisons between the groups were analyzed using Student’s t-tests. ** stands for the comparison between the control group and simulated transport stress group (P < 0.01)

