
Fig. 15.
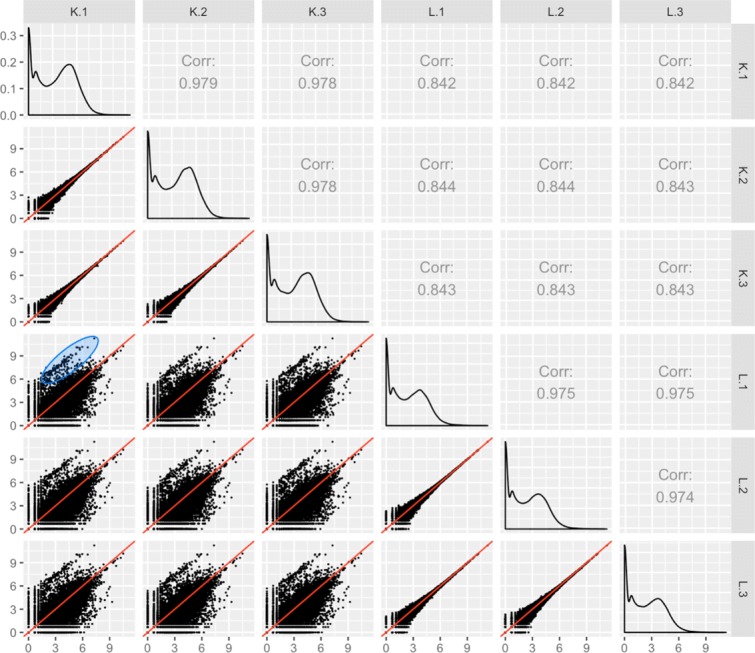
Scatterplot matrix detects unexpected structure in liver and kidney technical replicate RNA-seq dataset. Scatterplot matrix of liver and kidney technical replicates [12]. The technical replicate scatterplots look precise as is expected, with little variability around the x=y line. The treatment group scatterplots have much more variability around the x=y line, as we would expect. However, each treatment group scatterplot contains a pronounced streak of highly-expressed liver-specific genes, which deviates from the expected distribution (shown in blue oval in one example scatterplot). Some researchers have suggested that differences in the distribution of reads between groups may require particularly stringent normalization