
Fig. 17.
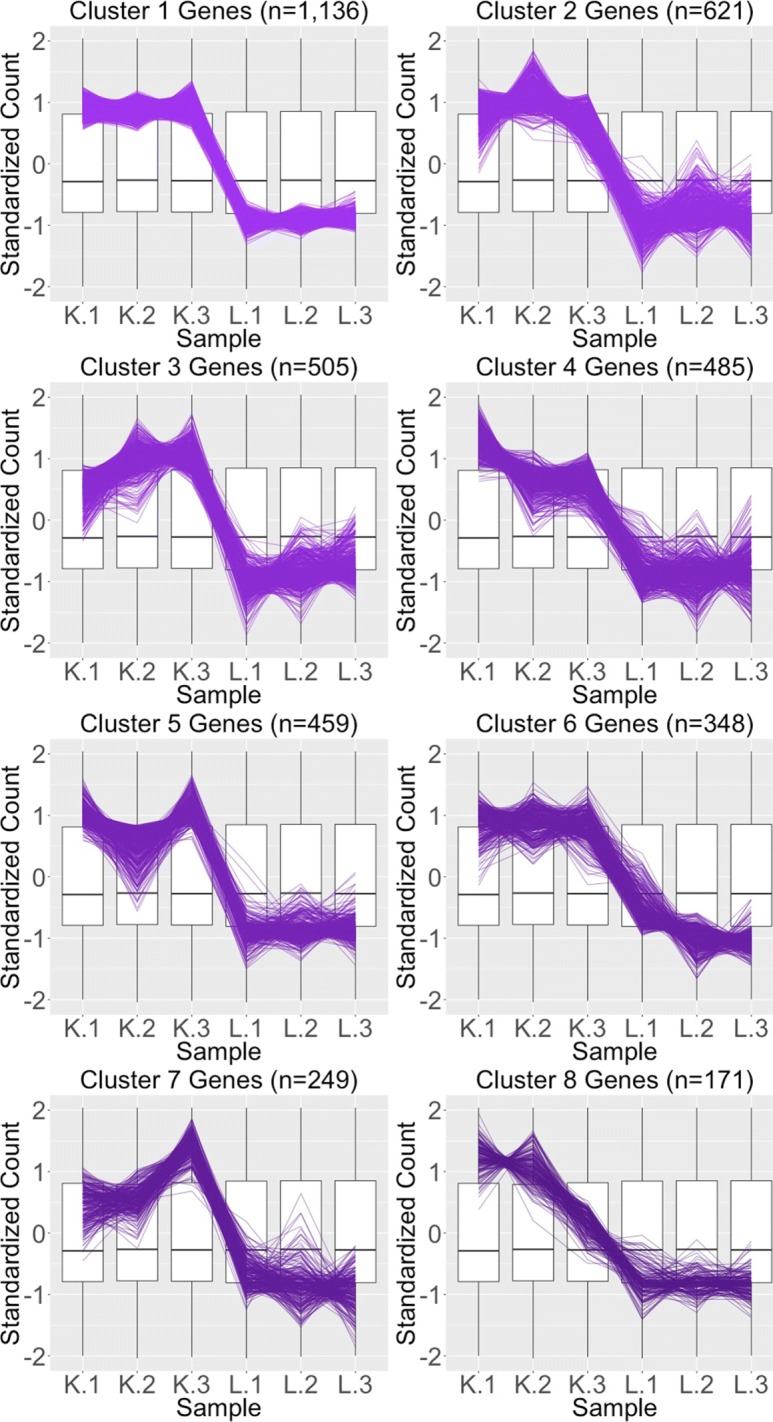
Parallel coordinate plots for gene clusters that remained as kidney-specific DEGs after TMM normalization. Parallel coordinate plots showing eight hierarchical clusters from the 3974 genes that remained in the kidney-specific DEGs after TMM normalization. We see that, for the most part, the parallel coordinate patterns follow the expected patterns across the clusters. The ideal pattern of DEGs is especially captured in the first cluster (the largest one with 1136 genes). We applied ombre coloring across the clusters in order of cluster size. We used hierarchical clustering to tease apart subtle pattern differences and to mitigate additional overplotting that would occur if we were to plot all genes onto only one parallel coordinate plot. The side-by-side boxplots represent all gene counts in the dataset