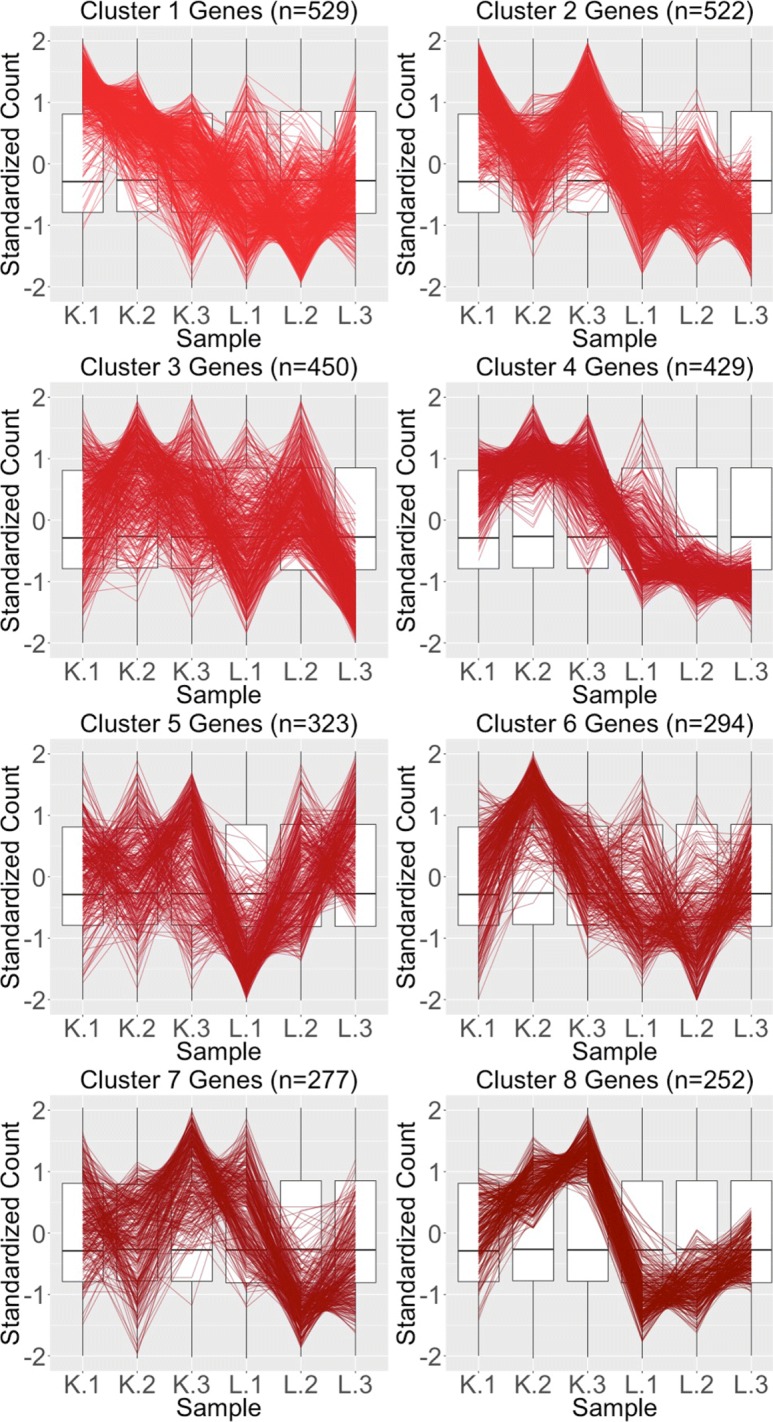
Fig. 19.

Parallel coordinate plots for gene clusters that were removed from kidney-specific DEGs after TMM normalization. Parallel coordinate plots showing eight hierarchical clusters from the 3076 genes that were removed from the kidney-specific DEGs after TMM normalization. The patterns in almost all clusters do not resemble the expected DEG format; instead, they show large variability between replicates and small variability between treatments. This plot provides additional statistical evidence that the application of TMM normalization successfully removed genes that were previously mislabeled as kidney-specific DEGs with library size scaling normalization. We used hierarchical clustering to tease apart subtle pattern differences and to mitigate overplotting. The side-by-side boxplots represent all gene counts in the dataset
