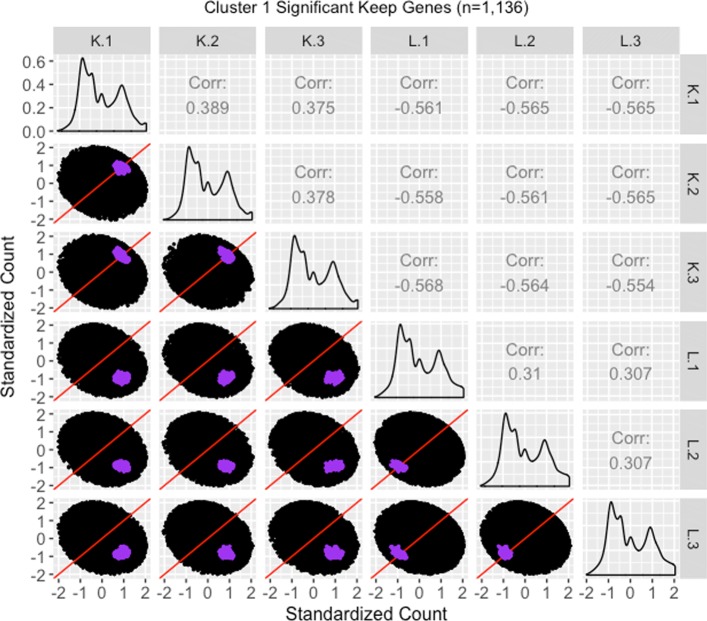
Fig. 21.
Standardized scatterplot matrix for gene cluster that remained as kidney-specific DEGs after TMM normalization. Scatterplot matrix of the standardized 1136 genes that were in the first cluster (Fig. 17) from genes that remained as kidney-specific DEGs even after TMM normalization. Even though the standardization process removes the interesting geometrical features we would otherwise see, it amplifies DEG patterns more clearly. Here, the highlighted genes appear more clustered and separated from the x=y line in the treatment scatterplots, and more clustered and connected to the x=y line in the replicate scatterplots. We can also now see more clearly in the replicate scatterplots that the kidney expression is higher than the liver expression

