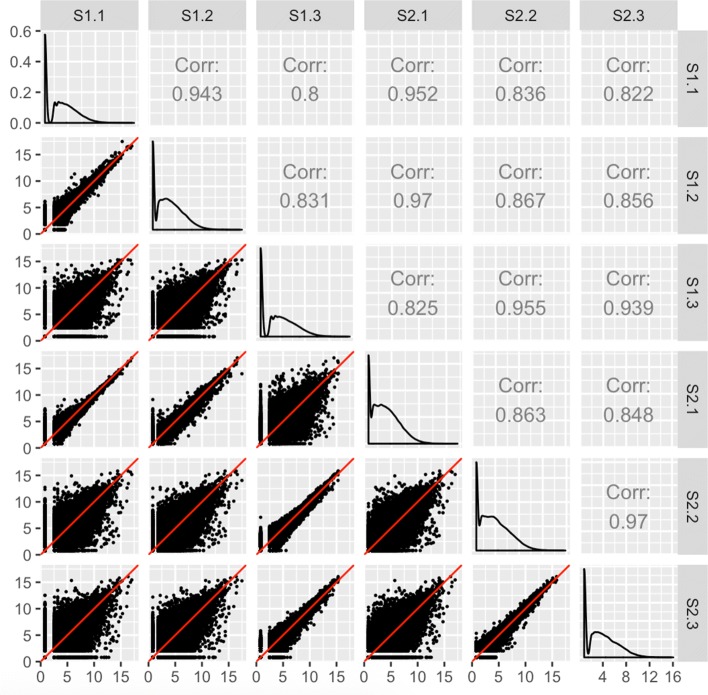
Fig. 5.
Checking common errors of RNA-seq data analysis using scatterplot matrices. As expected, the scatterplot matrix of the coytledon data [27] contains nine scatterplots with thicker distributions (should be treatment pairs) and six scatterplots with thinner distributions (should be replicate pairs). However, a subset of scatterplots unexpectedly show thicker distributions between replicate pairs and thinner distributions between treatment pairs. If we switch the labels of two suspicious samples (S1.3 and S2.1), the scatterplot matrix displays the anticipated structure we saw in Fig. 3. At this point, we have evidence that these two samples may have been mislabeled, and we may wish to confirm this suspicion and correct it before continuing with the analysis

