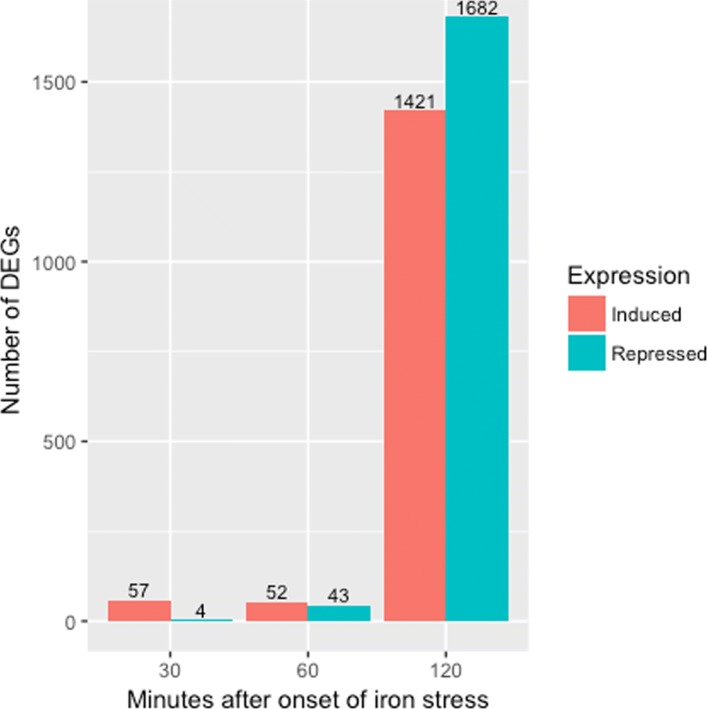
Fig. 8.
Gene expression responses across time points. The authors of the soybean iron metabolism study [24] determined the DEGs across three times points (30 min, 60 min, and 120 min) in the leaves after onset of iron sufficient and deficient hydroponic conditions. They used the same researcher to collect the samples in succession. One major finding from their study was a vaste change in gene expression responses between these three time points. As a result, the streak observed in the scatterplot matrix containing the subset of data at the 120 min time point (Fig. 7) may be due to the timing differences between replicate handling

