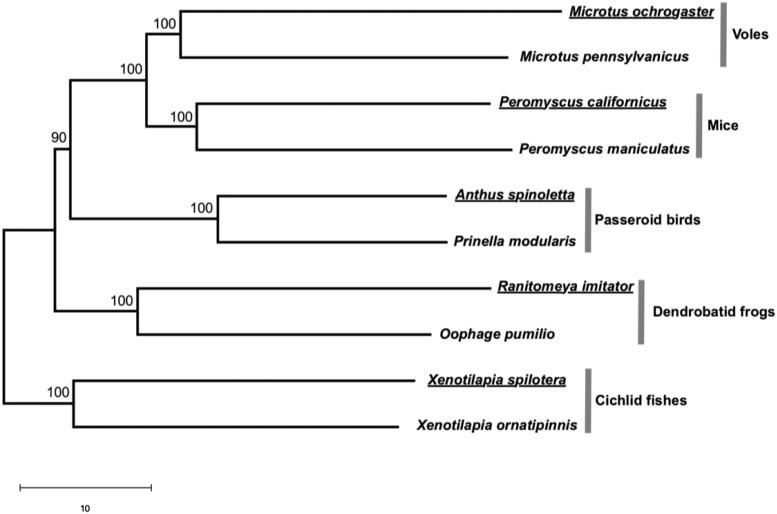
Fig. 1.
Neighbor-joining (NJ) tree of the neural transcriptomes of the 10 species studied in Young et al. (1). Bootstrap percentages are placed on interior branches. Branch lengths are drawn to scale, and the scale bar below the tree shows 10 units in Euclidian distance. Names of monogamous species are underlined. Following ref. 2, for each gene i of species j, we converted the raw expression level Xij to the standardized expression level Yij = (Xij Xi)/Si, where Xi and Si are respectively the mean and SD of the expression level of gene i among the 10 species. We calculated the transcriptomic Euclidian distance between species j and k using the standardized expression levels of n = 1,979 genes by . Using standardized instead of raw expression levels equalizes the contributions of different genes to the distance. We then built the NJ tree using these distances. The confidence of the tree was assessed by bootstrapping all genes 100 times. The tree was inferred in R (4) and plotted by MEGA (5).

