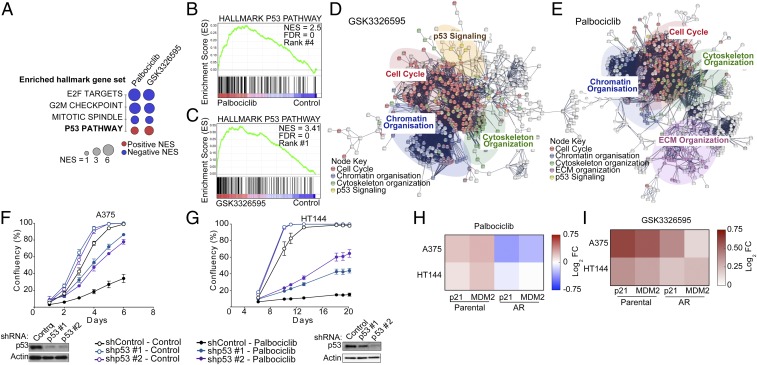
Fig. 4.
Activation of the p53 pathway is critical for the response to Palbociclib and GSK3326595. (A) Dot plot of commonly enriched Hallmark gene sets in A375 cells treated with either 1 μΜ palbociclib or 500 nM GSK3326595 for 72 h compared to control. Normalized enrichment score (NES) ≥ 3.00 or ≤ −3.00, FDR P ≤ 0.01. (B and C) GSEA of genes differentially expressed in the A375 cells after treatment as in A. (D and E) Network analysis on genes that changed expression after treatment as in A. (F and G) Proliferation curves of cells expressing shTP53 (p53) or shControl treated with 2 μM palbociclib. Graphs are representative of 2 independent experiments. Error bars represent SEM for 3 technical replicates. Western blots confirm p53 knockdown. (H and I) Heat maps showing the fold change in gene expression in A375 and HT144 cells after 6-d treatment with 2 μΜ palbociclib or 500 nM GSK3326595, respectively; 3 biological replicates, each with 3 technical replicates.

