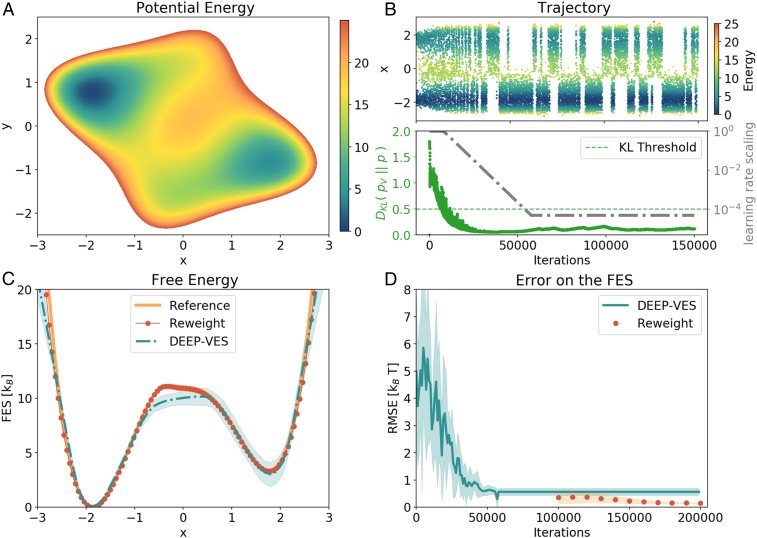
Fig. 2.
Results for the 2D model. (A) Potential energy surface of the model. (B, Upper) CV evolution as a function of the number of iterations. The points are colored according to their energy value. (B, Lower) Evolution of the KL divergence between the bias and the target distribution (green) and learning rate scaling factor (gray). When the KL divergence is lowered below the threshold value, the learning rate is decreased exponentially until it is practically zero. (C) Free-energy profiles obtained from the NN and with the reweighting procedure, compared with the reference obtained by integrating the model. For the DEEP-VES curve, also an estimate of the error is given by averaging the results of 8 different simulations. The lack of accuracy on the left shoulder is a consequence of the combination of the suboptimal character of the chosen variable and the strength of the bias, which creates new pathways other than the one of minimum energy. These artifacts are removed by performing the reweight with the static bias potential . (D) RMSE on the FES computed in the regions of 10 from the reference minimum.

