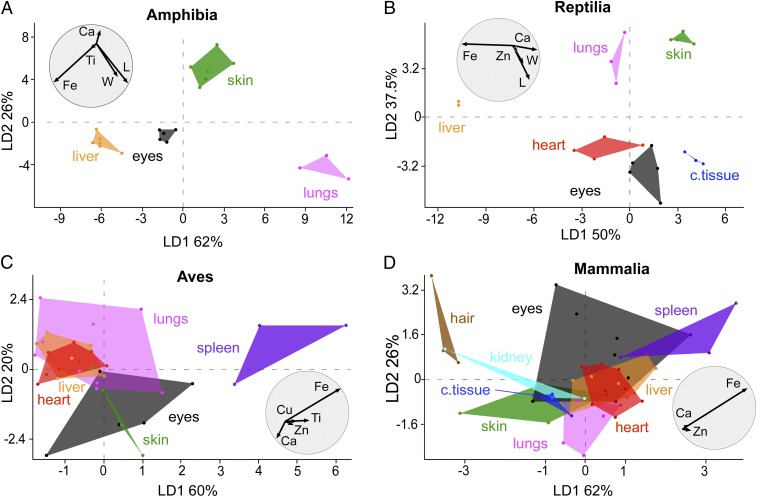
Fig. 3.
Linear discriminant analysis (LDA) of geometry and elemental chemistry of melanosomes from extant vertebrates: Amphibia (A), Reptilia (B), Aves (C), Mammalia (D). Each LDA plot is accompanied by a biplot (grey circle) that shows the most discriminating variables contributing to the separation among groups. c. tissue, connective tissue; L, length; W, width.

