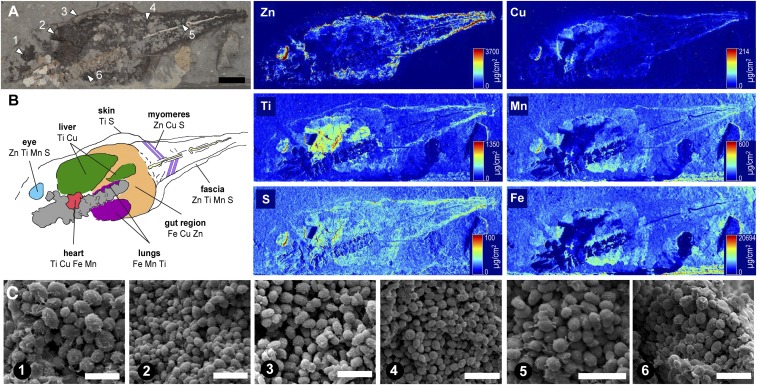
Fig. 4.
Analysis of fossil tadpole NHML-R4999 (P. pueyoi, Libros). (A) Location of sampling points (arrowheads). (B) Interpretation of internal anatomy is based on the location, geometry, and chemistry (as shown in the SRS-XRF elemental maps for S, Ti, Mn, Fe, Cu, and Zn) of melanosomes from distinct regions. (C) Scanning electron micrographs of fossil melanosomes; numbers denote sampling points in A. (Scale bars: A, 10 mm; C, 2 μm.)

