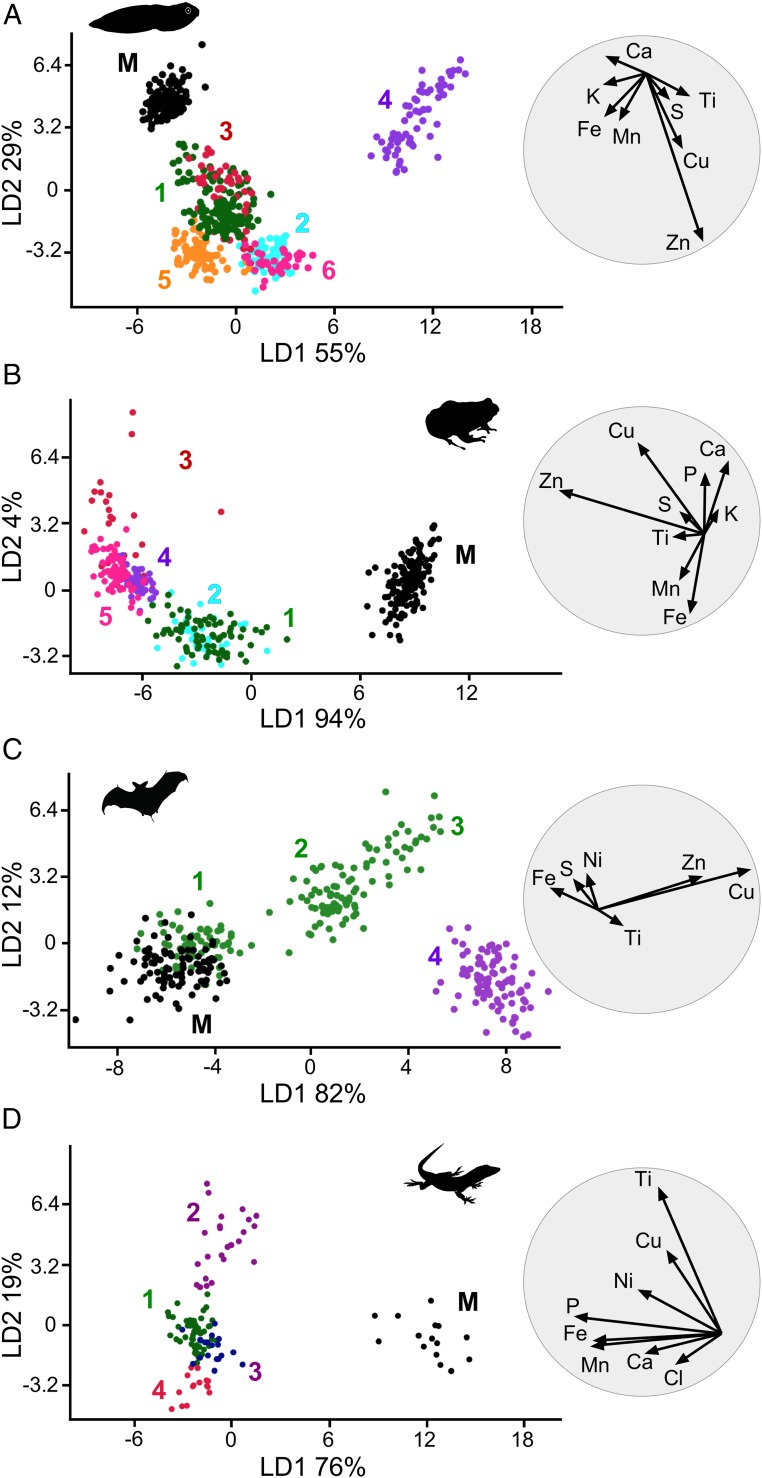
Fig. 6.
Linear discriminant analysis of elemental chemistry of fossil melanosomes. (A) NHML-R4999 (P. pueyoi, Libros). (B) NHML-R4982 (P. pueyoi, Libros). (C) HMLD Me7069b (Chiroptera indet., Messel). (D) HMLD Me9018 (Reptilia indet., Messel). Each LDA plot is accompanied by a biplot (to the right). Numbers denote regions of interest (ROIs) (SI Appendix, Fig. S22) mapped using SRS-XRF; note that these numbers do not correspond to the sampling points for SEM analysis. M denotes sedimentary matrix (A–C) or resin (D). Colors that correspond to unequivocal organs: green, skin; cyan, eyespot; magenta, other soft tissue features.

