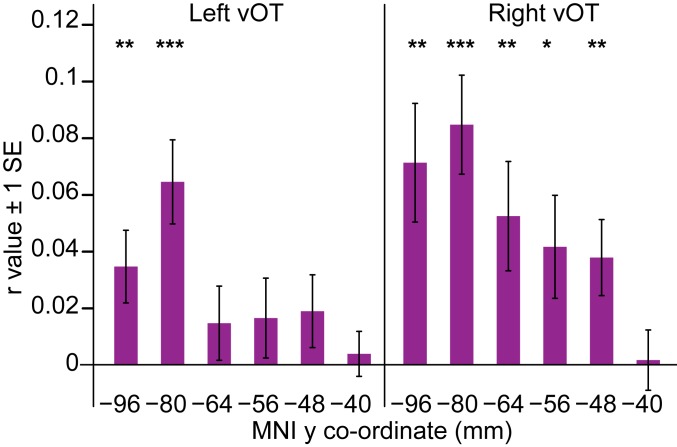
Fig. 5.
Correlations between the neural and visual DSM in left- and right-hemisphere ROIs, from posterior to anterior vOT along the x axis. MNI y coordinates express the distance in millimeters from the anterior commissure to the center of each ROI in Fig. 4B. Asterisks denote whether second-level one-sample t tests in each ROI indicated a significantly greater than zero correlation (one-tailed t test, ***P < 0.001, **P < 0.01, *P < 0.05). SE bars are appropriate for these one-sample t tests.

