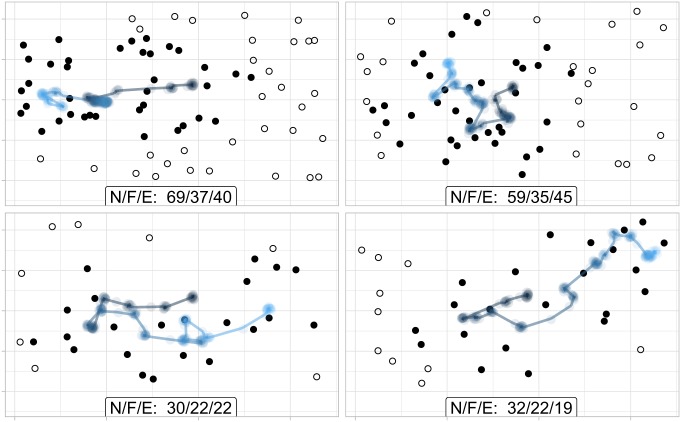
Fig. 3.
Example fixation paths of one subject in the 3-s time condition, with each panel representing a single trial. The points represent the dots displayed on their screen, where filled dots represent the ones that were foveated. At the bottom of each panel, a label N/F/E shows how many dots were shown , how many were foveated , and what quantity the participant actually estimated .

