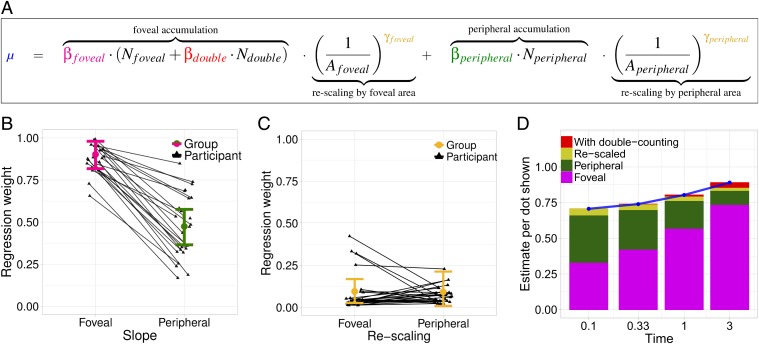
Fig. 6.
(A) The mean estimate, , given as a function of the number of dots foveated, ; the number of dots not foveated, ; the percent of screen area foveated, ; the percent of screen area not foveated, ; and the number of dots foveated more than once, . Each of these has a corresponding parameter quantifying its contribution to the estimate . (B) Parameters and capture the foveal and peripheral contribution to the accumulated count. (C) Parameters and capture the degree to which the accumulated count is normalized by the percent of screen for area foveated () or peripheral (). (D) A visualization of how each factor contributes to over time. As exposure time increases, the average proportion of dots foveated increases, leading to differences in the expected contribution of each factor to the mean estimate.

