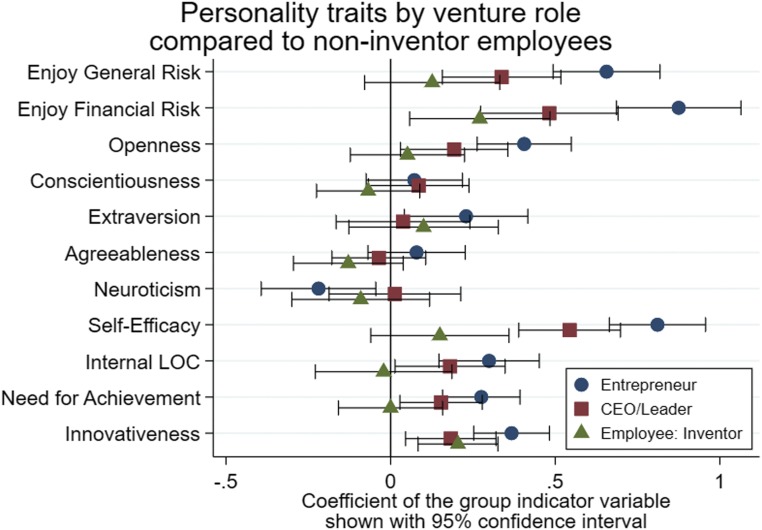
Fig. 1.
Regression results for personality traits of entrepreneurs, nonfounder CEOs/leaders, and inventor employees working at a CIC facility compared to noninventor employees. These categories are mutually exclusive and collectively exhaustive. Personality traits are measured on a 5-point scale, and the analysis reports coefficients and 95% confidence intervals for indicator variables indicating the respondent’s role. Regressions control for age, gender, ethnicity, immigration status, education level, education field, full-time status, and prior experience in the industry of individuals; n = 874 to 948. SI Appendix, Tables S6a–S6c report underlying regressions.

