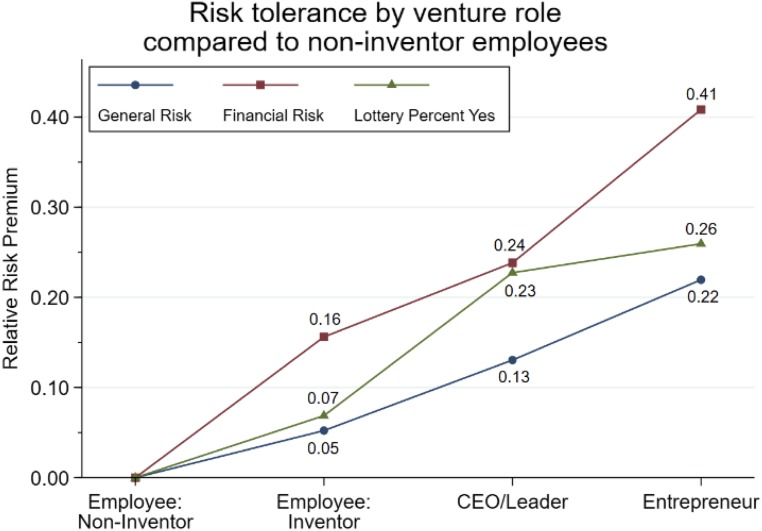
Fig. 2.
Percentage difference in risk tolerance of entrepreneurs, nonfounder CEOs/leaders, and inventor employees working at a CIC facility compared to noninventor employees. General Risk and Financial Risk metrics are built through individual’s responses to survey questions. The Lottery metric captures the propensity of individuals to select entering a lottery rather than accepting a fixed gift card as a reward for completing the survey; n = 874 to 948.

