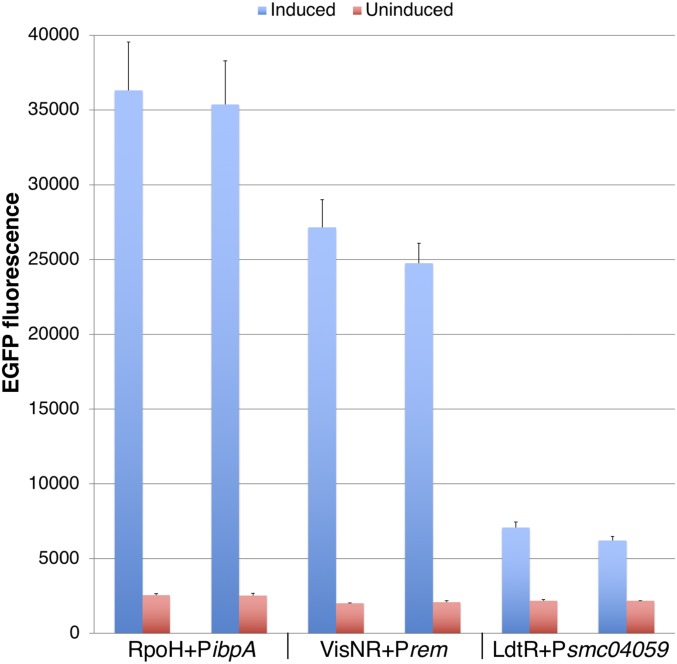
Fig. 1.
EGFP fluorescence for IPTG-induced and uninduced high-throughput screening strains. Each S. meliloti strain was tested in duplicate 384-well plates for EGFP fluorescence. Each column indicates the average of raw signal values for IPTG-induced (n = 352) and uninduced (n = 16) wells. Error bars indicate SD. The CLas transcription regulator and S. meliloti promoter of each strain are indicated below the x axis. Mean EGFP fluorescence for M9 sucrose medium negative controls was 293 (n = 96). Strains: ΔrpoH1rpoH2 CLas-RpoH PibpA (MB231 pMB949); ΔvisNR CLas-VisNR Prem (MB1102 pMB956); ΔldtR CLas-LdtR Psmc04059 (MB1101 pMB958).

